
Economic Research 经济研究
Anthropic Economic Index report: economic primitivesAnthropic 经济指数报告:经济基本要素
2026年1月15日

Introduction 引言
How is AI reshaping the economy?人工智能如何重塑经济?
This report introduces new metrics of AI usage to provide a rich portrait of interactions with Claude in November 2025, just prior to the release of Opus 4.5. These “primitives”—simple, foundational measures of how Claude is used, which we generate by asking Claude specific questions about anonymized Claude.ai and first-party (1P) API transcripts—cover five dimensions relevant to AI’s economic impact: user and AI skills, how complex tasks are, the degree of autonomy afforded to Claude, how successful Claude is, and whether Claude is used for personal, educational, or work purposes.
本报告引入了衡量 AI 使用情况的新指标,以全面描绘 2025 年 11 月(即 Opus 4.5 发布前夕)用户与 Claude 的交互情况。这些“基本要素”(primitives)——即通过向 Claude 提出特定问题,基于匿名化的 Claude.ai 和第一方(1P)API 对话记录生成的、反映 Claude 使用方式的简单而基础的度量——涵盖五个与 AI 经济影响相关的维度:用户与 AI 的技能水平、任务的复杂程度、赋予 Claude 的自主程度、Claude 的成功程度,以及 Claude 是用于个人、教育还是工作用途。
The results reveal striking geographic variation, real-world estimates of AI task horizons, and a basis for revised assessments of Claude’s macroeconomic impact.
研究结果揭示了显著的地理差异、对 AI 任务实际应用范围的现实估计,以及重新评估 Claude 宏观经济影响的基础。
The data we release alongside this report are the most comprehensive to date, covering five new dimensions of AI use, consumer and firm use, and country and region breakdowns for Claude.ai.
本报告同步发布的新数据是迄今为止最全面的,涵盖了 AI 使用的五个新维度,包括消费者和企业使用情况,以及按国家和地区的 Claude.ai 使用细分。
What has changed since our last report自上一份报告以来发生了哪些变化
In the first chapter, we revisit findings from our previous Economic Index report published in September 2025. We find:
在第一章中,我们回顾了 2025 年 9 月发布的上一份《经济指数报告》中的发现。我们发现:
- **Claude usage remains concentrated among certain tasks, most of them related to coding
Claude 的使用仍集中在某些特定任务上,其中大多数与编程相关。
**While we see over 3,000 unique work tasks in Claude.ai, the top 10 most common tasks account for 24% of our sampled conversations, a slight increase since our last report. Augmentation patterns (conversations where the user learns, iterates on a task, or gets feedback from Claude) edged to just over half of conversations on Claude.ai. In contrast, automated use remains dominant in 1P API traffic, reflecting its programmatic nature.
尽管我们在 Claude.ai 上观察到超过 3,000 种独特的工作任务,但使用频率最高的前 10 项任务占我们抽样对话的 24%,较上一份报告略有上升。增强型交互模式(用户在对话中学习、迭代任务或从 Claude 获得反馈)在 Claude.ai 上的对话占比略超一半。相比之下,自动化使用在 1P API 流量中仍占主导地位,这反映了其程序化特性。 - **Global usage remains persistently uneven while US states converge
全球使用情况持续不均衡,而美国各州的使用则趋于收敛
**The US, India, Japan, the UK, and South Korea lead in overall Claude.ai use. Worldwide, uneven adoption remains well-explained by GDP per capita. Within the US, workforce composition plays a key role in shaping uneven adoption as states with more computer and mathematical professionals show systematically more Claude usage.
美国、印度、日本、英国和韩国在 Claude.ai 的总体使用量上处于领先地位。全球范围内,人均 GDP 仍能很好地解释 Claude 使用分布的不均衡性。在美国国内,劳动力结构对使用分布的不均衡起着关键作用——拥有更多计算机和数学相关专业人员的州,Claude 的使用量系统性地更高。
While substantial concentration remains, since our last report Claude usage has become noticeably more evenly distributed across US states. If sustained, usage per capita would be equalized across the country in 2-5 years.
尽管使用仍存在显著集中现象,但自上一份报告以来,Claude 在美国各州的使用分布已明显变得更加均衡。若这一趋势持续下去,全国人均使用量有望在 2 至 5 年内实现均等化。
Introducing and analyzing our new economic primitives引入并分析我们的新经济原语
In the second chapter we discuss the motivation for and introduce our new economic primitives, including how they were selected and operationalized, and their limitations. We additionally present evidence that our primitives capture directionally accurate aspects of underlying usage patterns as compared to external benchmarks. In chapters three and four we use these primitives to further investigate implications for adoption and productivity. We find:
在第二章中,我们探讨了新提出的经济原语(economic primitives)背后的动机,并对其进行了介绍,包括这些原语的选择与操作化方法及其局限性。此外,我们还提供了证据,表明与外部基准相比,我们的原语在方向上准确地捕捉了底层使用模式的某些方面。在第三章和第四章中,我们利用这些原语进一步探究了 AI 对采用率和生产力的影响。我们发现:
-
**Claude use diversifies with higher adoption and income
Claude 的使用随普及率和收入水平提高而日益多元化
**While the most common use of Claude is for work, coursework use is highest in countries with the lowest GDP per capita, while rich countries show the highest rates of personal use. This aligns with a simple adoption curve story: early adopters in less developed countries tend to be technical users with specific, high-value applications or use Claude for education, whereas mature markets see usage diversify toward casual and personal purposes.
尽管 Claude 最常见的用途是工作,但在人均 GDP 最低的国家,其用于课程学习的比例最高;而富裕国家则表现出最高的个人使用率。这与简单的采用曲线理论一致:在欠发达国家,早期采用者往往是具有特定高价值应用场景的技术用户,或将其用于教育目的;而在成熟市场,使用则逐渐向休闲和个人用途多样化发展。 -
**Claude succeeds on most tasks, but less so on the most complex ones
Claude 在大多数任务上表现良好,但在最复杂的任务上表现稍逊。
**We find that Claude generally succeeds at the tasks it is given, and that the education level of its responses tends to match the user’s input. Claude struggles on more complex tasks: As the time it would take a human to do the task increases, Claude’s success rate falls, much like prominent evals measuring the longest tasks that AIs can reliably perform.
我们发现,Claude 通常能够成功完成所给任务,其回答的教育水平往往与用户的输入相匹配。然而,在更复杂的任务上,Claude 会遇到困难:随着人类完成某项任务所需时间的增加,Claude 的成功率随之下降,这与那些用于衡量 AI 能够可靠执行的最长任务的主流评估结果非常相似。 -
**Job exposure to AI looks different when success rates are factored in
在考虑成功率因素后,各职业受 AI 影响的情况呈现出不同的面貌。
**We also use the success rate primitive to better understand job exposure to AI, calculating the share of each occupation that Claude can perform by weighting task coverage by both success rates and the importance of each task within the job. For some occupations, like data entry keyers and database architects, Claude shows proficiency in large swaths of the job.
我们还利用“成功率”这一基本指标,更深入地理解不同职业受 AI 影响的程度:通过结合任务覆盖率、Claude 在各项任务上的成功率,以及每项任务在该职业中的重要性,计算出 Claude 能够胜任的各职业工作比例。对于某些职业,如数据录入员和数据库架构师,Claude 在工作中很大一部分任务上都展现出熟练能力。 -
**Claude is used for higher-skill tasks than those in the broader economy
Claude 所用于的任务比整体经济中的任务技能要求更高
**The tasks we observe in Claude usage tend to require more education than those in the broader economy. If we assume that AI-assisted tasks diminish as a share of worker responsibilities, removing them would leave behind less-skilled work. But this simple task displacement would not affect white-collar workers uniformly—for some occupations it removes the most skill-intensive tasks, for others the least.
我们观察到的 Claude 使用任务通常比整体经济中的任务需要更高的教育水平。如果我们假设 AI 辅助任务在员工职责中所占比例逐渐减少,那么移除这些任务后,剩下的将是技能要求较低的工作。但这种简单的任务替代并不会对白领工作者产生均等影响——对某些职业而言,被移除的是技能要求最高的任务,而对另一些职业而言,则是最不需要技能的任务。Without the tasks that we observe Claude performing, travel agents would experience deskilling as complex planning work gives way to routine ticket purchasing and payment collection. Property managers, by contrast, would experience upskilling as bookkeeping tasks give way to contract negotiations and stakeholder management.
如果没有我们观察到 Claude 执行的那些任务,旅行代理将面临技能降级,因为复杂的行程规划工作将被常规的机票购买和收款工作所取代。相比之下,物业经理则会经历技能升级,因为簿记类任务将被合同谈判和利益相关者管理所取代。
A new window for understanding AI’s impact on the economy理解人工智能对经济影响的新窗口
These results provide a new window into how AI is currently impacting the economy. Knowing the success rate of tasks gives a more accurate picture of which tasks might be automated, how impacted certain jobs might be, and how labor productivity will change. Measuring differential performance by user education sheds light on inequality effects.
这些结果为我们提供了一个全新的视角,以了解人工智能当前对经济的影响。了解任务的成功率能够更准确地描绘出哪些任务可能被自动化、某些工作岗位可能受到多大程度的影响,以及劳动生产率将如何变化。通过用户教育水平来衡量性能差异,有助于揭示人工智能对不平等现象的影响。
Indeed, the close relationship between education levels in inputs and outputs signals that countries with higher educational attainment may be better positioned to benefit from AI, independent of adoption rates alone.
事实上,输入和输出中教育水平之间的紧密关联表明,教育水平较高的国家可能更有能力从人工智能中获益,而不仅仅取决于其技术采用率。
This data release aims to enable researchers and the public to better understand the economic implications of AI and investigate the ways in which this transformative technology is already having an effect.
本次数据发布旨在帮助研究人员和公众更好地理解人工智能的经济影响,并探究这项变革性技术已经产生的各种效应。
Chapter 1: What has changed since our last report第一章:自上一份报告以来发生了哪些变化
Overview 概述
Because frontier AI model capabilities are improving rapidly and adoption has been swift, it is important to regularly take stock of changes in how people and businesses are using such systems—and what this usage implies for the broader economy.1
由于前沿 AI 模型的能力正在快速提升,且其采用速度迅猛,因此有必要定期评估人们和企业使用此类系统的方式发生了哪些变化——以及这种使用对更广泛经济的影响。 1
In this chapter we analyze how Claude usage and diffusion patterns changed from August 2025 to November 2025 just prior to the release of Opus 4.5. We make four observations:
在本章中,我们分析了在 Opus 4.5 发布前夕,从 2025 年 8 月到 2025 年 11 月期间 Claude 的使用情况和扩散模式的变化。我们得出以下四点观察:
-
Usage remains highly concentrated across tasks:
使用仍高度集中在特定任务上:
The ten most common tasks represent 24% of observed usage on Claude.ai, up from 23% in our last report. For first-party (1P) API enterprise customers, concentration among tasks increased more notably: the top ten tasks now represent 32% of traffic, up from 28% in the last report.
十大最常见任务在 Claude.ai 上的使用占比达到 24%,高于上一份报告中的 23%。对于第一方(1P)API 企业客户,任务集中度的上升更为显著:前十大任务目前占总流量的 32%,而上一份报告中为 28%。 -
**Augmentation is once again more common than automation on Claude.ai:
在 Claude.ai 上,增强型任务再次比自动化任务更为常见:
**In our previous report we noted that automated use had risen to exceed augmented use on Claude.ai, perhaps capturing both improving capabilities and greater familiarity among users with LLMs. Data from November 2025 points to a broad-based shift back toward augmented use on Claude.ai: The share of conversations classified as augmented jumped 5pp to 52% and the share deemed automated fell 4pp to 45%.2 Product changes during this period—including file creation capabilities, persistent memory, and Skills for workflow customization —may have shifted usage patterns toward more collaborative, human-in-the-loop interactions.
在上一份报告中,我们注意到自动化用途的使用比例已超过增强型用途,这可能反映了模型能力的提升以及用户对 LLMs 的熟悉程度增加。然而,2025 年 11 月的数据显示,Claude.ai 上的使用模式正广泛地重新转向增强型用途:被归类为增强型的对话占比跃升 5 个百分点至 52%,而被认定为自动化的对话占比则下降 4 个百分点至 45%。 2 此期间推出的产品变更——包括文件创建功能、持久记忆以及用于工作流定制的 Skills——可能推动了使用模式向更强调人机协作、人在环路(human-in-the-loop)的交互方式转变。 -
**Within the US, lower usage states have relatively faster gains in adoption
在美国国内,使用率较低的州在采用速度上相对更快
**Within the US, usage per capita remains largely shaped by how well-matched the workforce is to broader Claude usage: For example, states with a larger share of workers in computer and mathematical occupations tend to have higher usage. Indeed, the top five US states account for nearly half (50%) of all usage despite representing only 38% of the working-age population.
在美国国内,人均使用量在很大程度上仍取决于劳动力与 Claude 整体应用的匹配程度:例如,从事计算机和数学类职业的劳动者比例较高的州,其使用率往往更高。事实上,美国使用量排名前五的州占据了全国近一半(50%)的使用量,尽管这些州的劳动年龄人口仅占全国的 38%。Nevertheless, there are early signs of rapid regional convergence in adoption: usage has increased relatively faster for states that had lower usage in our last report. If sustained, usage per capita would be equalized across the country in 2-5 years, a pace of diffusion roughly 10x faster than the spread of previous economically consequential technologies in the 20th century.3
尽管如此,已有初步迹象表明各地区在采用速度上正快速趋同:在我们上一份报告中使用率较低的州,其使用量增长相对更快。如果这一趋势持续下去,全国范围内的人均使用量将在 2 至 5 年内趋于均衡,这一扩散速度大约是 20 世纪其他具有重大经济影响的技术普及速度的 10 倍。 3While this is consistent with rapid AI adoption and diffusion, this estimate comes with uncertainty given that it is based on a change observed over a three month period. Diffusion may ultimately proceed more slowly in the months and years to come.
虽然这与人工智能的快速采用和扩散趋势一致,但该估算仍存在不确定性,因为它基于仅三个月期间观察到的变化。在未来数月乃至数年中,扩散速度最终可能会放缓。 -
**Global usage shows little sign of increasing or decreasing regional convergence
全球范围内的使用情况尚未显示出区域间趋同程度明显增强或减弱的迹象。
**Globally, Claude usage per capita—as captured by the Anthropic AI Usage Index (AUI)—remains highly uneven and strongly correlated with GDP. These gaps are stable: we see no evidence that low-use countries are catching up or that high-use countries are pulling away.
从全球范围来看,人均 Claude 使用量(以 Anthropic 人工智能使用指数(AUI)衡量)仍极不均衡,且与 GDP 高度相关。这些差距保持稳定:我们没有发现低使用量国家正在追赶或高使用量国家正在进一步拉大差距的证据。
Shifting patterns of usage across tasks and associated occupations不同任务及其相关职业的使用模式变化
Even though frontier LLMs have an impressive range of capabilities relevant to every facet of the modern economy, Claude usage remains very concentrated among a small number of tasks. As compared to nearly one year ago, consumer usage on Claude.ai is modestly more concentrated: The share of conversations assigned to the ten most prevalent O*NET tasks was 24% in November 2025, 1pp higher than in August and up from 21% in January 2025. The most prevalent task in November 2025—modifying software to correct errors—alone represented 6% of usage.
尽管前沿 LLMs 具备令人印象深刻的能力,覆盖现代经济的方方面面,但 Claude 的使用仍高度集中于少数几类任务。与近一年前相比,Claude.ai 上的消费者使用更加集中:2025 年 11 月,被归类到十大最常见 O*NET 任务的对话占比为 24%,比 8 月高出 1 个百分点,也高于 2025 年 1 月的 21%。其中,2025 年 11 月最普遍的任务——修改软件以修正错误——单独就占了 6%的使用量。
In our last Anthropic Economic Index Report we began tracking business adoption patterns by studying Claude usage among 1P API customers. The ten most common tasks grew from 28% of API records in August to 32% in November. Rising concentration among a small set of tasks suggests the highest-value applications continue to generate outsized economic value even as models have become more capable at a wider range of tasks. As with Claude.ai the most common task among API customers was modifying software to correct errors, which accounted for one in ten records.
在上一份《Anthropic 经济指数报告》中,我们开始通过研究 1P API 客户对 Claude 的使用情况来追踪企业采用模式。十大最常见任务在 API 记录中的占比从 8 月的 28%上升至 11 月的 32%。尽管模型在更广泛的任务上能力不断增强,但少数任务的使用集中度持续上升,表明高价值应用场景仍在创造不成比例的经济价值。与 Claude.ai 类似,在 API 客户中最常见的任务是修改软件以修正错误,该任务占所有记录的十分之一。
Indeed, computer and mathematical tasks—like modifying software to correct errors—continue to dominate Claude usage overall, representing a third of conversations on Claude.ai and nearly half of 1P API traffic. Such dominance has subsided on Claude.ai: the share of conversations on Claude.ai assigned to such (mostly) coding-related tasks is down from a peak of 40% in March 2025 to 34% in November 2025. At the same time, the share of transcripts assigned to computer and mathematical tasks among 1P API traffic edged higher from 44% in August to 46% in November 2025 (Figure 1.2).
事实上,计算机和数学类任务——例如修改软件以修正错误——总体上仍占据 Claude 使用的主要部分,在 Claude.ai 上的对话中占比三分之一,在 1P API 流量中占比接近一半。不过,这类任务在 Claude.ai 上的主导地位已有所减弱:被归类为(主要)与编码相关任务的 Claude.ai 对话占比,从 2025 年 3 月的峰值 40%下降至 2025 年 11 月的 34%。与此同时,在 1P API 流量中,被归类为计算机和数学类任务的交互记录占比则从 2025 年 8 月的 44%微增至 11 月的 46%(图 1.2)。
The second largest share of Claude.ai usage in November 2025 was in the Educational Instruction and Library category. This corresponds mostly to help with coursework and review, and the development of instructional materials. Such usage has risen steadily since our first report, up from 9% of conversations on Claude.ai in January 2025 to 15% in November.
2025 年 11 月,Claude.ai 使用量第二大的类别是教育指导与图书馆服务。这类使用主要涉及课程作业辅导、复习协助以及教学材料的开发。自我们发布首份报告以来,此类用途稳步上升,从 2025 年 1 月占 Claude.ai 对话总量的 9%增长至 11 月的 15%。
The share of usage on Claude.ai for Arts, Design, Entertainment, Sports, and Media tasks increased between August and November 2025 as Claude was used in a growing share of conversations for writing tasks, primarily copyediting and the writing and refinement of fictional pieces. This jump in the prevalence of design- and writing-related tasks reversed a steady decline across earlier reports. For both Claude.ai and API customers, there was a drop in the share of conversations/transcripts where Claude was used for Life, Physical, and Social Science-related tasks.
2025 年 8 月至 11 月期间,Claude.ai 在艺术、设计、娱乐、体育和媒体类任务中的使用占比有所上升,这主要源于 Claude 在写作类对话中所占比例持续增长,尤其是用于文字校对以及虚构作品的撰写与润色。这一设计与写作相关任务使用率的显著上升,扭转了此前报告中该类别使用占比持续下降的趋势。与此同时,无论是 Claude.ai 用户还是 API 客户,将 Claude 用于生命科学、物理科学及社会科学相关任务的对话/记录占比均有所下降。
Perhaps the most notable development for API customers was the increase in the share of transcripts associated with Office and Administrative Support related tasks, which rose 3pp in August to 13% in November 2025. Because API use is automation-dominant, this suggests that businesses are increasingly using Claude to automate routine back-office workflows such as email management, document processing, customer relationship management, and scheduling.4
对于 API 客户而言,最显著的变化或许是与“办公及行政支持”相关任务的对话记录占比上升——从 8 月到 2025 年 11 月,这一比例上升了 3 个百分点,达到 13%。由于 API 使用以自动化为主,这表明企业正越来越多地利用 Claude 来自动化日常后台工作流程,例如邮件管理、文档处理、客户关系管理以及日程安排。 4
Augmentation is again dominant on Claude.ai在 Claude.ai 平台上,增强型使用再次占据主导地位。
How AI will affect the economy depends not just on the tasks Claude is used for but the way that users access and engage underlying model capabilities. Since our first report, we have classified conversations into one of five interaction types, which we group into two broader categories: automation and augmentation.5
AI 对经济的影响不仅取决于 Claude 所执行的任务,还取决于用户访问和使用底层模型能力的方式。自我们发布首份报告以来,我们将对话划分为五种交互类型,并进一步归入两大类别:自动化和增强型。 5
Figure 1.3 plots how automated versus augmented use has evolved over time since we first started collecting this data one year ago. In January 2025, augmented use of Claude was dominant: 56% of conversations were classified as augmentation compared to 41% automated.6 In August 2025, more conversations were classified as automated as compared to augmented.
图 1.3 展示了自我们一年前开始收集此类数据以来,自动化使用与增强型使用随时间的演变情况。2025 年 1 月,Claude 的增强型使用占主导地位:56%的对话被归类为增强型,而自动化型仅占 41%。 6 到 2025 年 8 月,被归类为自动化型的对话数量已超过增强型。
This was a notable development since it suggested that rapid improvements in model capabilities and platform functionality coincided with users increasingly delegating tasks entirely to Claude. This was evident in the “directive” collaboration mode, which is further grouped as automation. Directive conversations are those in which users give Claude a task and it completes it with minimal back-and-forth. From January 2025 to August 2025 the share of such directive conversations rose from 27% to 39%.7
这是一个值得注意的变化,因为它表明模型能力与平台功能的快速提升,恰逢用户越来越多地将任务完全委托给 Claude。这一点在“指令性”协作模式中尤为明显,该模式被进一步归类为自动化。所谓指令性对话,是指用户向 Claude 下达任务,而 Claude 在极少来回交互的情况下完成任务。从 2025 年 1 月至 2025 年 8 月,此类指令性对话的占比从 27%上升至 39%。 7
Three months later, the share of directive conversations had fallen 7pp to 32% in November 2025 as augmentation once again became more prevalent on Claude.ai than automation. Nevertheless, the automation share was still elevated as compared to nearly one year ago when we first began tracking this measure, suggesting that the underlying trend is still toward greater automation even as the August spike overstated how quickly it was materializing.
三个月后,指令性对话的占比在 2025 年 11 月下降了 7 个百分点,降至 32%,此时增强型使用方式在 Claude.ai 上再次比自动化更为普遍。尽管如此,与近一年前我们首次开始追踪这一指标时相比,自动化所占比例仍处于较高水平,这表明尽管 8 月的激增夸大了自动化实际落地的速度,但整体趋势仍朝着更高程度的自动化方向发展。
While we see some evidence of a shift toward soft skill usage on Claude.ai with design, management, and education now higher, the shift back toward augmented use was broad-based in November (Figure 1.4). The rise in augmented use was driven mainly by users iterating with Claude to complete tasks (“task iteration”) rather than asking Claude to explain concepts (“learning”). See Figure 1.5 for common words associated with the three most common interaction modes across O*NET tasks and bottom-up descriptions of requests made of Claude.
尽管我们观察到一些迹象表明,Claude.ai 上的使用正逐渐转向软技能领域,设计、管理和教育类任务的使用比例有所上升,但在 11 月,用户使用行为又广泛地回归到增强型使用模式(图 1.4)。这种增强型使用模式的增长主要源于用户通过与 Claude 反复迭代来完成任务(“任务迭代”),而非让 Claude 解释概念(“学习”)。图 1.5 展示了在 O*NET 任务中三种最常见交互模式下,以及用户对 Claude 提出请求的自下而上描述中所关联的常用词汇。
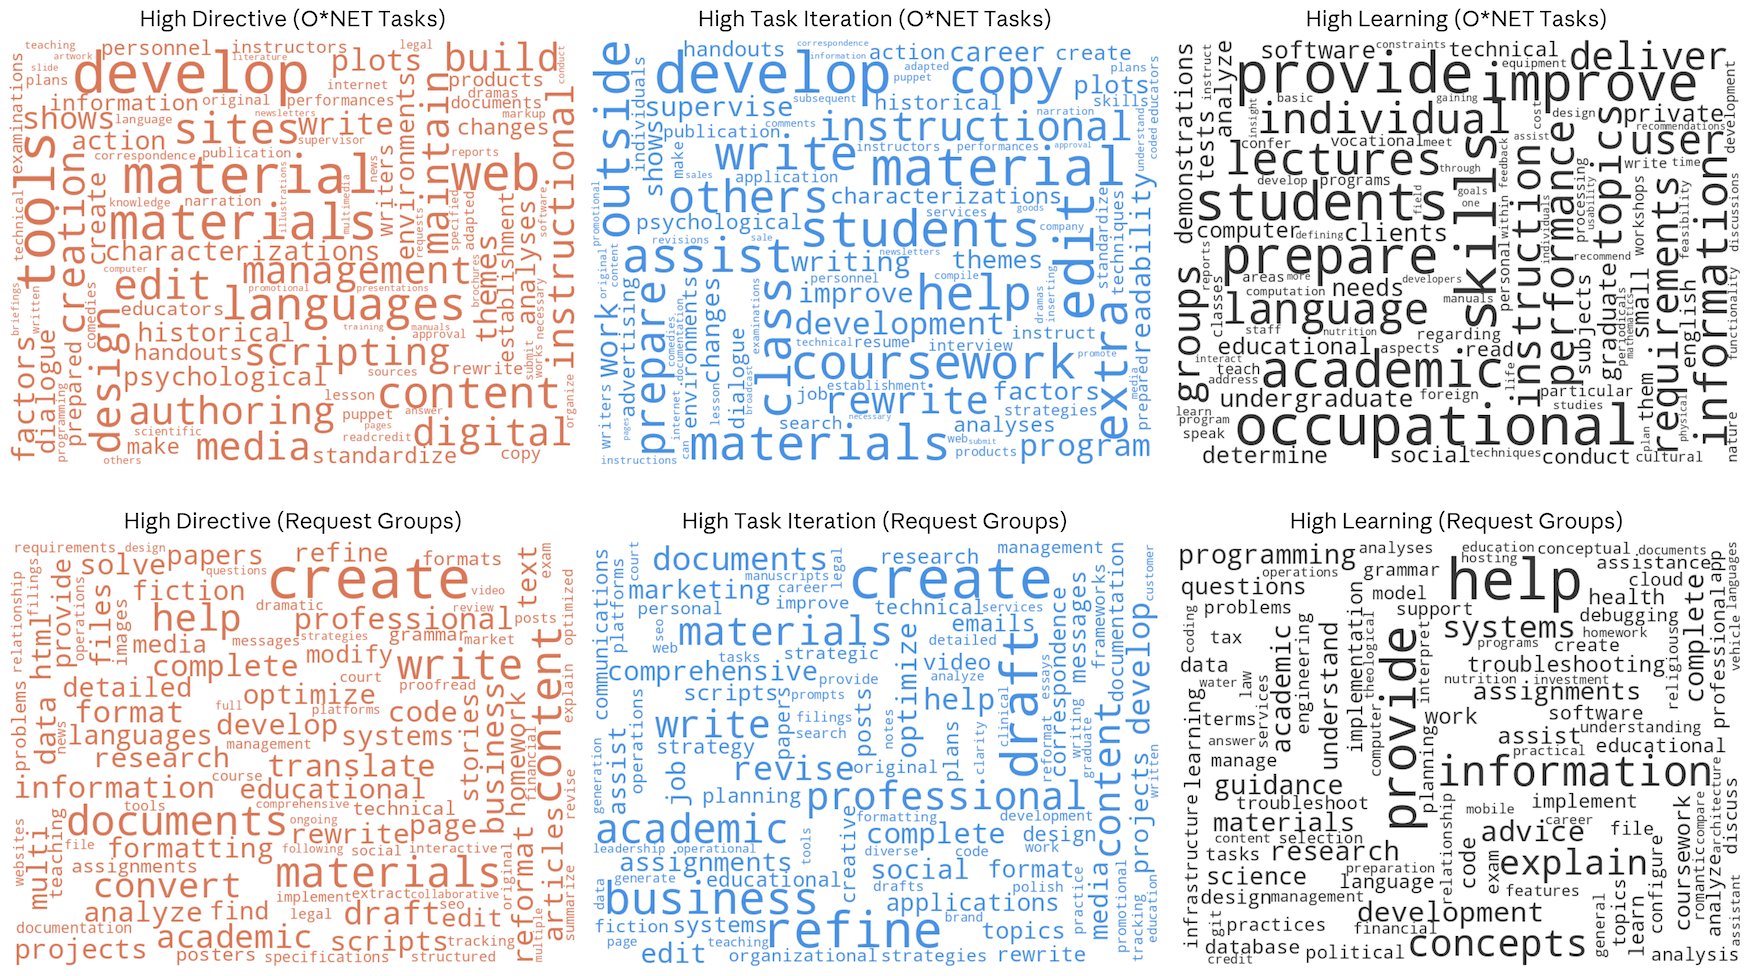
Figure 1.5: Prominent words from among O*NET task titles and bottom-up request groupings by key collaboration type. 图 1.5:按主要协作类型划分的 O*NET 任务标题与自下而上请求分组中的高频词汇。 Word clouds constructed from among the top quartile of O*NET tasks and bottom-up request groups, ordered by the share of records classified as Directive, Task Iteration, and Learning from among tasks/requests with at least 1,000 observations. Directive interactions emphasize production (‘create,’ ‘develop,’ ‘draft’); Task Iteration centers on refinement and iteration (‘edit,’ ‘rewrite,’ ‘revise’); Learning focuses on explanation and knowledge transfer (‘help,’ ‘explain,’ ‘provide’). Patterns are consistent across both classification methods. This analysis is not based on the words used in the underlying transcripts but rather groupings constructed using privacy-preserving methods. 词云图基于 O*NET 任务中排名前四分之一的任务以及自下而上的请求分组构建而成,按被归类为“指令型”、“任务迭代型”和“学习型”的记录占比排序,仅包含至少有 1,000 条观测值的任务/请求。“指令型”交互强调产出(如“创建”、“开发”、“起草”);“任务迭代型”聚焦于优化与迭代(如“编辑”、“重写”、“修订”);“学习型”则侧重于解释与知识传递(如“帮助”、“解释”、“提供”)。两种分类方法所得出的模式一致。本分析并非基于原始对话文本中的具体用词,而是基于采用隐私保护方法构建的分组。
Persistent regional concentration持续的区域集中现象
In our previous report, we introduced the Anthropic AI Usage Index (AUI), a measure of whether Claude is over- or underrepresented in a given geography relative to the size of its working-age population. The AUI is defined as
在我们之前的报告中,我们引入了 Anthropic AI 使用指数(AUI),用于衡量 Claude 在特定地理区域中的使用频率相对于该地区劳动年龄人口规模而言是偏高还是偏低。AUI 的定义如下:
An AUI above 1 indicates that a country uses Claude more intensively than its population alone would predict, while an AUI below 1 indicates lower-than-expected usage. For example, Denmark has an AUI of 2.1, meaning its residents use Claude at roughly twice the rate its share of the global working-age population would suggest.
AUI 高于 1 表明该国对 Claude 的使用强度高于仅基于其人口规模所预期的水平,而 AUI 低于 1 则表示使用强度低于预期。例如,丹麦的 AUI 为 2.1,这意味着其居民使用 Claude 的频率大约是其在全球劳动年龄人口中所占比例所预期水平的两倍。
A key fact about Claude usage globally is that it is geographically concentrated: a small number of countries comprise an outsized share of use. From a global perspective, little changed in this respect between August and November 2025. Indeed, the left panel of Figure 1.6 shows that the AUI concentration across countries was essentially unchanged between our last report and this report.
关于 Claude 在全球使用情况的一个关键事实是,其使用在地理上高度集中:少数国家占据了远超其人口比例的使用份额。从全球视角来看,2025 年 8 月至 11 月期间,这一格局几乎没有变化。事实上,图 1.6 左侧面板显示,与上一份报告相比,各国 AUI(Anthropic 使用强度指数)的集中度基本保持不变。
By contrast, usage became more evenly distributed across US states from August to November 2025: the Gini coefficient, a standard measure of equality, fell from 0.37 to 0.32. While it is important to exercise caution in interpreting short-run changes, this is a relatively large change toward perfect equality in which the AUI is equal to 1 for all states with a Gini coefficient of 0. If the Gini coefficient for the US again falls by 0.05 every three months, then parity of usage would be reached in roughly two years.
相比之下,从 2025 年 8 月到 11 月,美国各州的使用情况变得更加均衡:衡量平等程度的常用指标——基尼系数从 0.37 下降至 0.32。尽管在解读短期变化时需谨慎,但这一变化幅度相对较大,朝着完全平等(即所有州的 AUI 均为 1,基尼系数为 0)的方向迈进。如果美国的基尼系数每三个月再次下降 0.05,那么大约两年内即可实现使用上的均等。
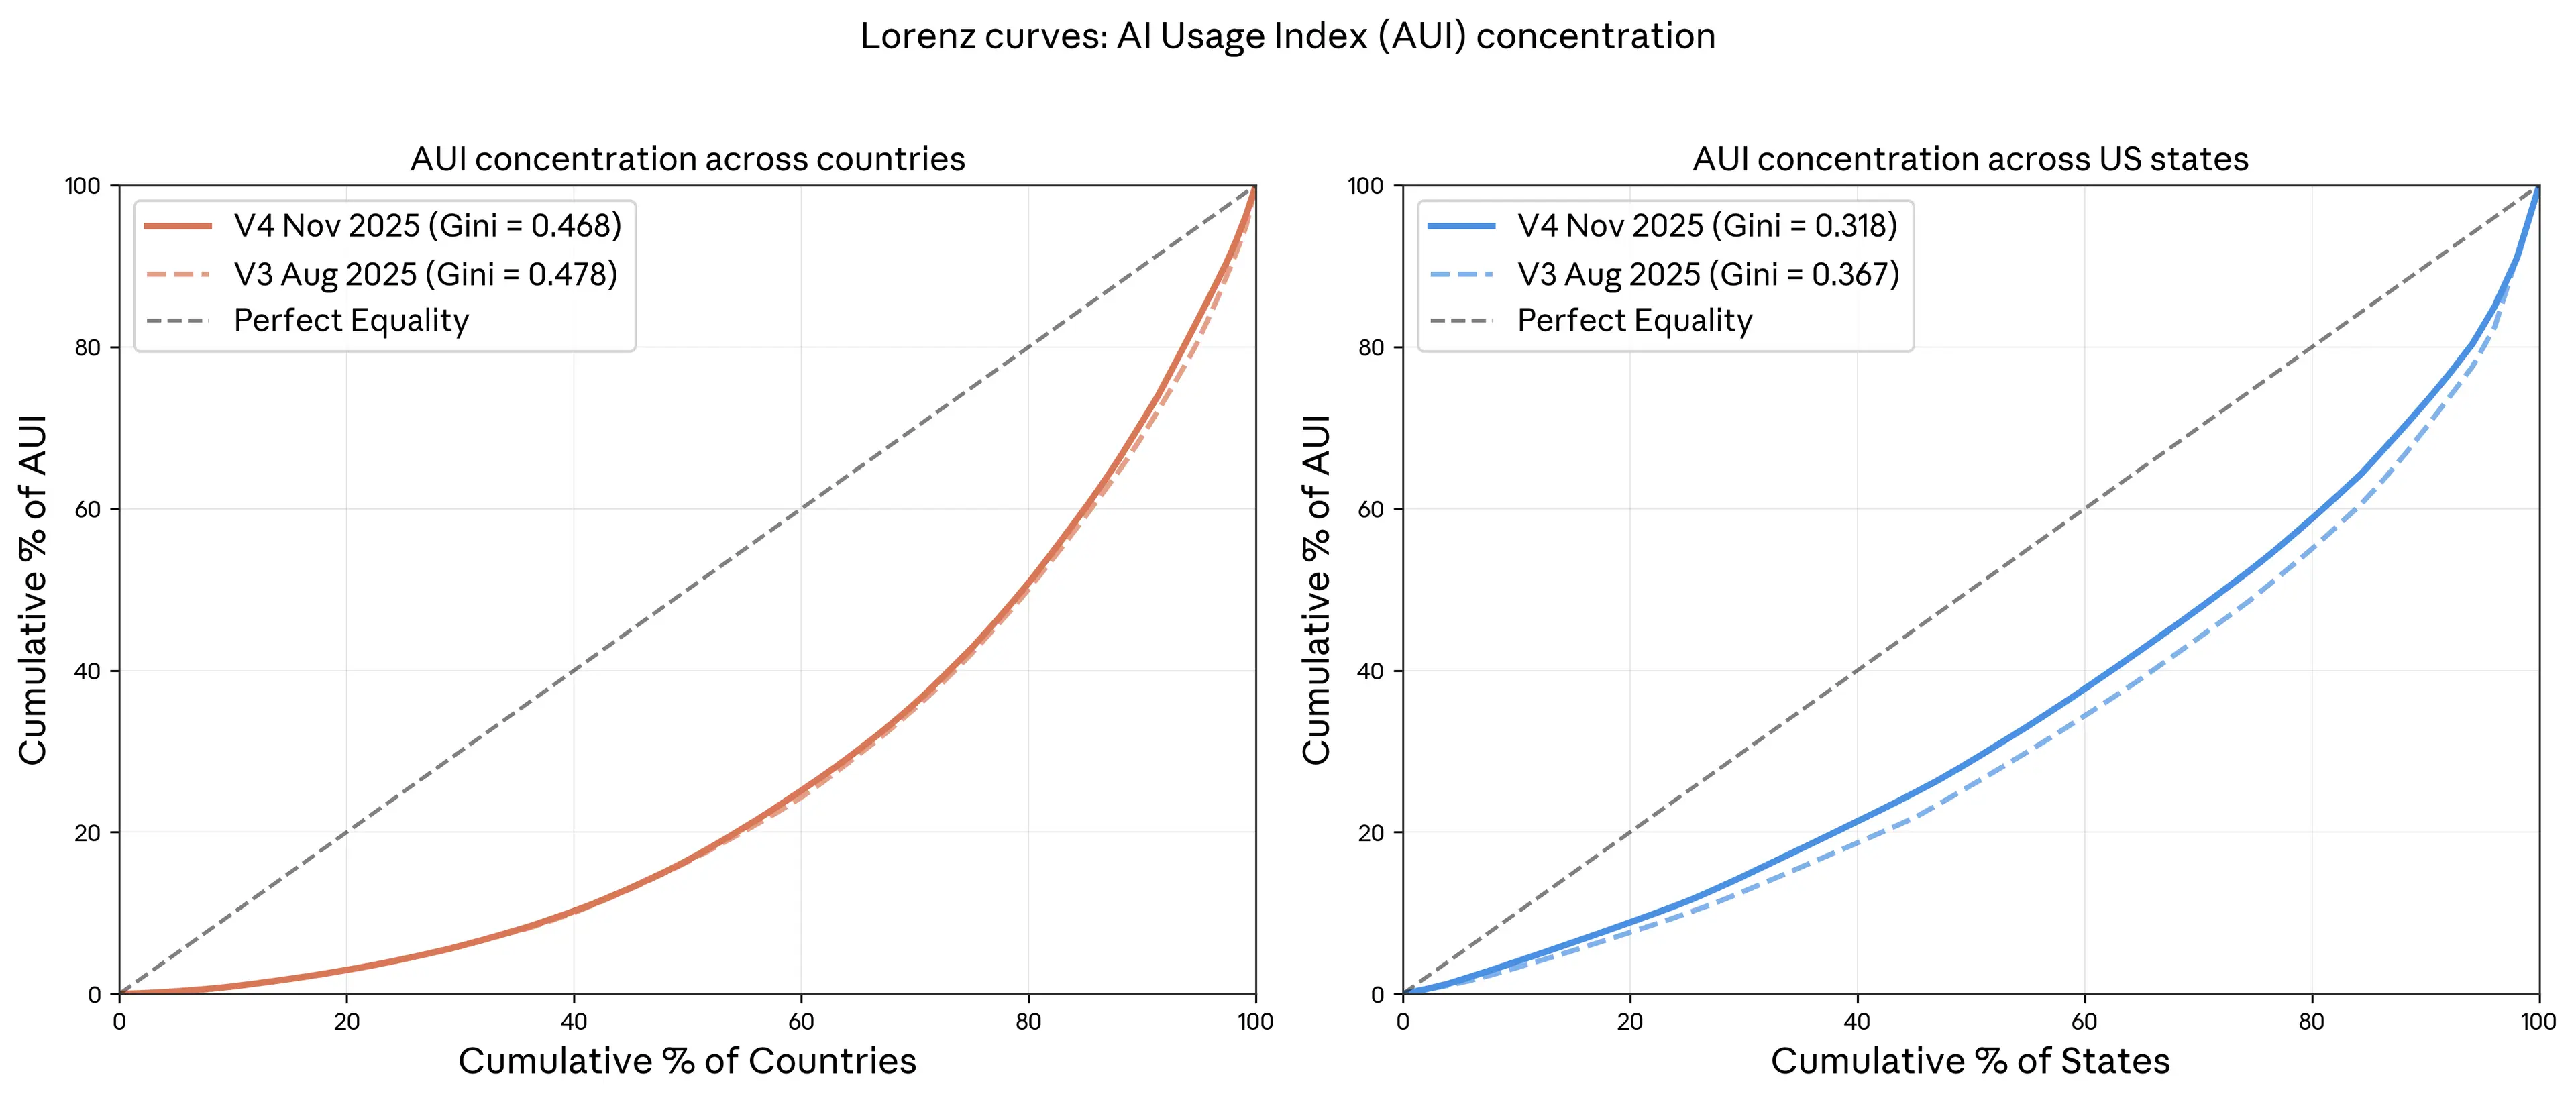
Figure 1.6: AUI concentration around the world and within the US in this and the prior report. 图 1.6:本报告与上一份报告中全球及美国境内的 AUI 集中度。 Lorenz curves for the Anthropic AI Usage Index (AUI) around the world and within the US, August and November 2025. A curve that is closer to the 45-degree line indicates less concentration. The plot on the right shows, for example, that the top 20 percent of US states accounted for 40 percent of population-adjusted usage in the US. 2025 年 8 月和 11 月全球及美国境内 Anthropic AI 使用指数(AUI)的洛伦兹曲线。越接近 45 度线的曲线,表示使用越分散、集中度越低。例如,右侧图表显示,美国前 20%的州占全国经人口调整后的使用量的 40%。
What shapes patterns of usage within the US and around the world? In our previous report we emphasized the key role played by income differences globally: Variation in Claude usage across countries is largely accounted for by variation in GDP per capita. In Chapter 3 we revisit the importance of income in shaping not just usage intensity but also patterns of usage around the world.
什么因素塑造了美国及全球范围内的使用模式?在我们之前的报告中,我们强调了全球收入差异所起的关键作用:各国 Claude 使用情况的差异在很大程度上可由人均 GDP 的差异解释。在第三章中,我们将重新审视收入的重要性,不仅在于其对使用强度的影响,也在于其对全球使用模式的塑造作用。
Within the US, income is less clearly a predictor of usage. Instead, what appears to matter most is the composition of each state’s workforce and how well-matched the workforce is to Claude capabilities as reflected in task-level usage. States that have a higher share of workers in computer and mathematical occupations—like Washington D.C., Virginia, and Washington—tend to have higher usage per capita. Quantitatively, each 1% increase in the share of such tech workers in a state is associated with 0.36% higher usage per capita (Figure 1.7). This alone accounts for nearly two-thirds of the cross-state variation in AUI.
在美国国内,收入作为使用率的预测指标并不那么明确。相反,各州劳动力的构成以及该劳动力与 Claude 能力的匹配程度(体现在任务层面的使用情况)似乎更为关键。计算机和数学类职业从业者占比较高的州——如华盛顿特区、弗吉尼亚州和华盛顿州——往往人均使用率更高。从数量上看,一个州此类科技从业者的比例每增加 1%,其人均使用率就相应提高 0.36%(图 1.7)。仅此一项因素就解释了各州 AUI 差异的近三分之二。
While we would intuitively expect Claude usage to be higher in states with more tech workers, this pattern holds more generally: Usage per capita is higher in states with more workers in occupations where Claude usage is overrepresented as compared to the US workforce (e.g., Arts, Design, Entertainment, Sports and Media) or with relatively fewer workers in occupations where Claude usage is low as compared to the national economy (e.g., Transportation and Material Moving). This can be seen by calculating the Kullback–Leibler (KL) divergence between the composition of each state’s workforce and the global composition of Claude usage. States with a lower KL divergence—and thus with a workforce that looks more similar to Claude usage patterns—tend to have higher usage per capita.
虽然我们凭直觉会认为,科技从业者较多的州对 Claude 的使用率更高,但这一模式具有更普遍的适用性:在那些从事 Claude 使用比例高于全美平均水平的职业(例如艺术、设计、娱乐、体育和媒体行业)的劳动力占比较高的州,或从事 Claude 使用比例低于全国经济平均水平的职业(例如运输和物料搬运行业)的劳动力占比较低的州,人均 Claude 使用率往往更高。这一点可以通过计算各州劳动力构成与全球 Claude 使用构成之间的 Kullback–Leibler(KL)散度来体现。KL 散度越低的州——即其劳动力结构与 Claude 使用模式越相似的州——通常人均使用率也越高。
Signs of faster Claude diffusion in the US among low usage states美国低使用率州中 Claude 扩散速度加快的迹象
While differences in workforce composition appear to play a role in shaping regional adoption within the US, early evidence suggests Claude is diffusing considerably faster than historical precedent would predict. Economically consequential technologies have historically taken around half a century to achieve full diffusion across the US (Kalanyi et al., 2025). By contrast, comparing Claude adoption rates in November 2025 to three months prior, we estimate that parity in adoption per capita across US states—as measured by the AUI—could be reached within 2–5 years. This estimate comes with a high degree of uncertainty as the precision of our estimates cannot rule out much slower rates of diffusion.
尽管美国劳动力构成的差异似乎在塑造各地区采用率方面起到了一定作用,但早期证据表明,Claude 的扩散速度远超历史先例所预测的水平。从历史经验来看,具有重大经济影响的技术通常需要约半个世纪才能在美国实现全面普及(Kalanyi 等,2025)。相比之下,通过将 2025 年 11 月的 Claude 采用率与三个月前的数据进行比较,我们估计,按 AUI(Anthropic 使用指数)衡量,美国各州人均采用率趋于一致可能仅需 2 至 5 年时间。不过,这一估计存在高度不确定性,因为我们的估算精度尚不足以排除扩散速度慢得多的可能性。
We generate this estimate through the lens of a simple model of diffusion, which we briefly describe here. We model diffusion as proportional convergence toward a common steady state of equalized usage per capita in which each state s has an AUI equal to 1:
我们通过一个简单的扩散模型得出这一估计,现简要描述如下。我们将扩散过程建模为各州向一个共同稳态的按比例收敛过程,该稳态下各州人均使用量相等,即每个州 s 的 AUI 均等于 1:
Under this model, the log deviation of AUI from steady state (AUI = 1) shrinks by a factor of β every three months, implying a half-life of ln(.5)/ln(β) quarters. For example, with quarterly data a value of β = 0.99 implies a half-life of about 17 years. To illustrate, starting from an initial AUI of 2, this means AUI would decline to around 1.4 after 17 years and to around 1.1 after 50 years. We take β = 0.99 as a sensible benchmark because it implies a pace of diffusion similar to economically consequential technologies in the 20th century.
在此模型下,AUI 偏离稳态(AUI = 1)的对数偏差每三个月会以β倍的速度衰减,这意味着其半衰期为 ln(0.5)/ln(β) 个季度。例如,若使用季度数据,当β = 0.99 时,半衰期约为 17 年。举例来说,若初始 AUI 为 2,则经过 17 年后,AUI 将下降至约 1.4;经过 50 年后,将进一步降至约 1.1。我们采用β = 0.99 作为合理的基准值,因为这暗示了与 20 世纪具有重大经济影响的技术扩散速度相近。
This model of convergence motivates the following regression specification 8:
这种收敛模型引出了以下回归设定 8 :
Naively estimating this equation by ordinary least squares (OLS) yields an estimate of β̂ ≈ 0.77. Weighted least squares (WLS) where we weight by each state’s workforce yields an estimate of β̂ ≈ 0.76 (Figure 1.8). Both are statistically distinguishable from 1 at conventional levels. Taken at face value, these estimates imply that it would take little more than two years for each state’s AUI to close most of the gap to 1.
若直接使用普通最小二乘法(OLS)对该方程进行估计,得到的β̂估计值约为 0.77。若采用加权最小二乘法(WLS),并以各州劳动力规模作为权重,则β̂估计值约为 0.76(见图 1.8)。在常规显著性水平下,这两个估计值均与 1 存在统计上的显著差异。若按字面理解,这些估计结果意味着各州的 AUI 将在略多于两年的时间内弥合其与 1 之间的大部分差距。
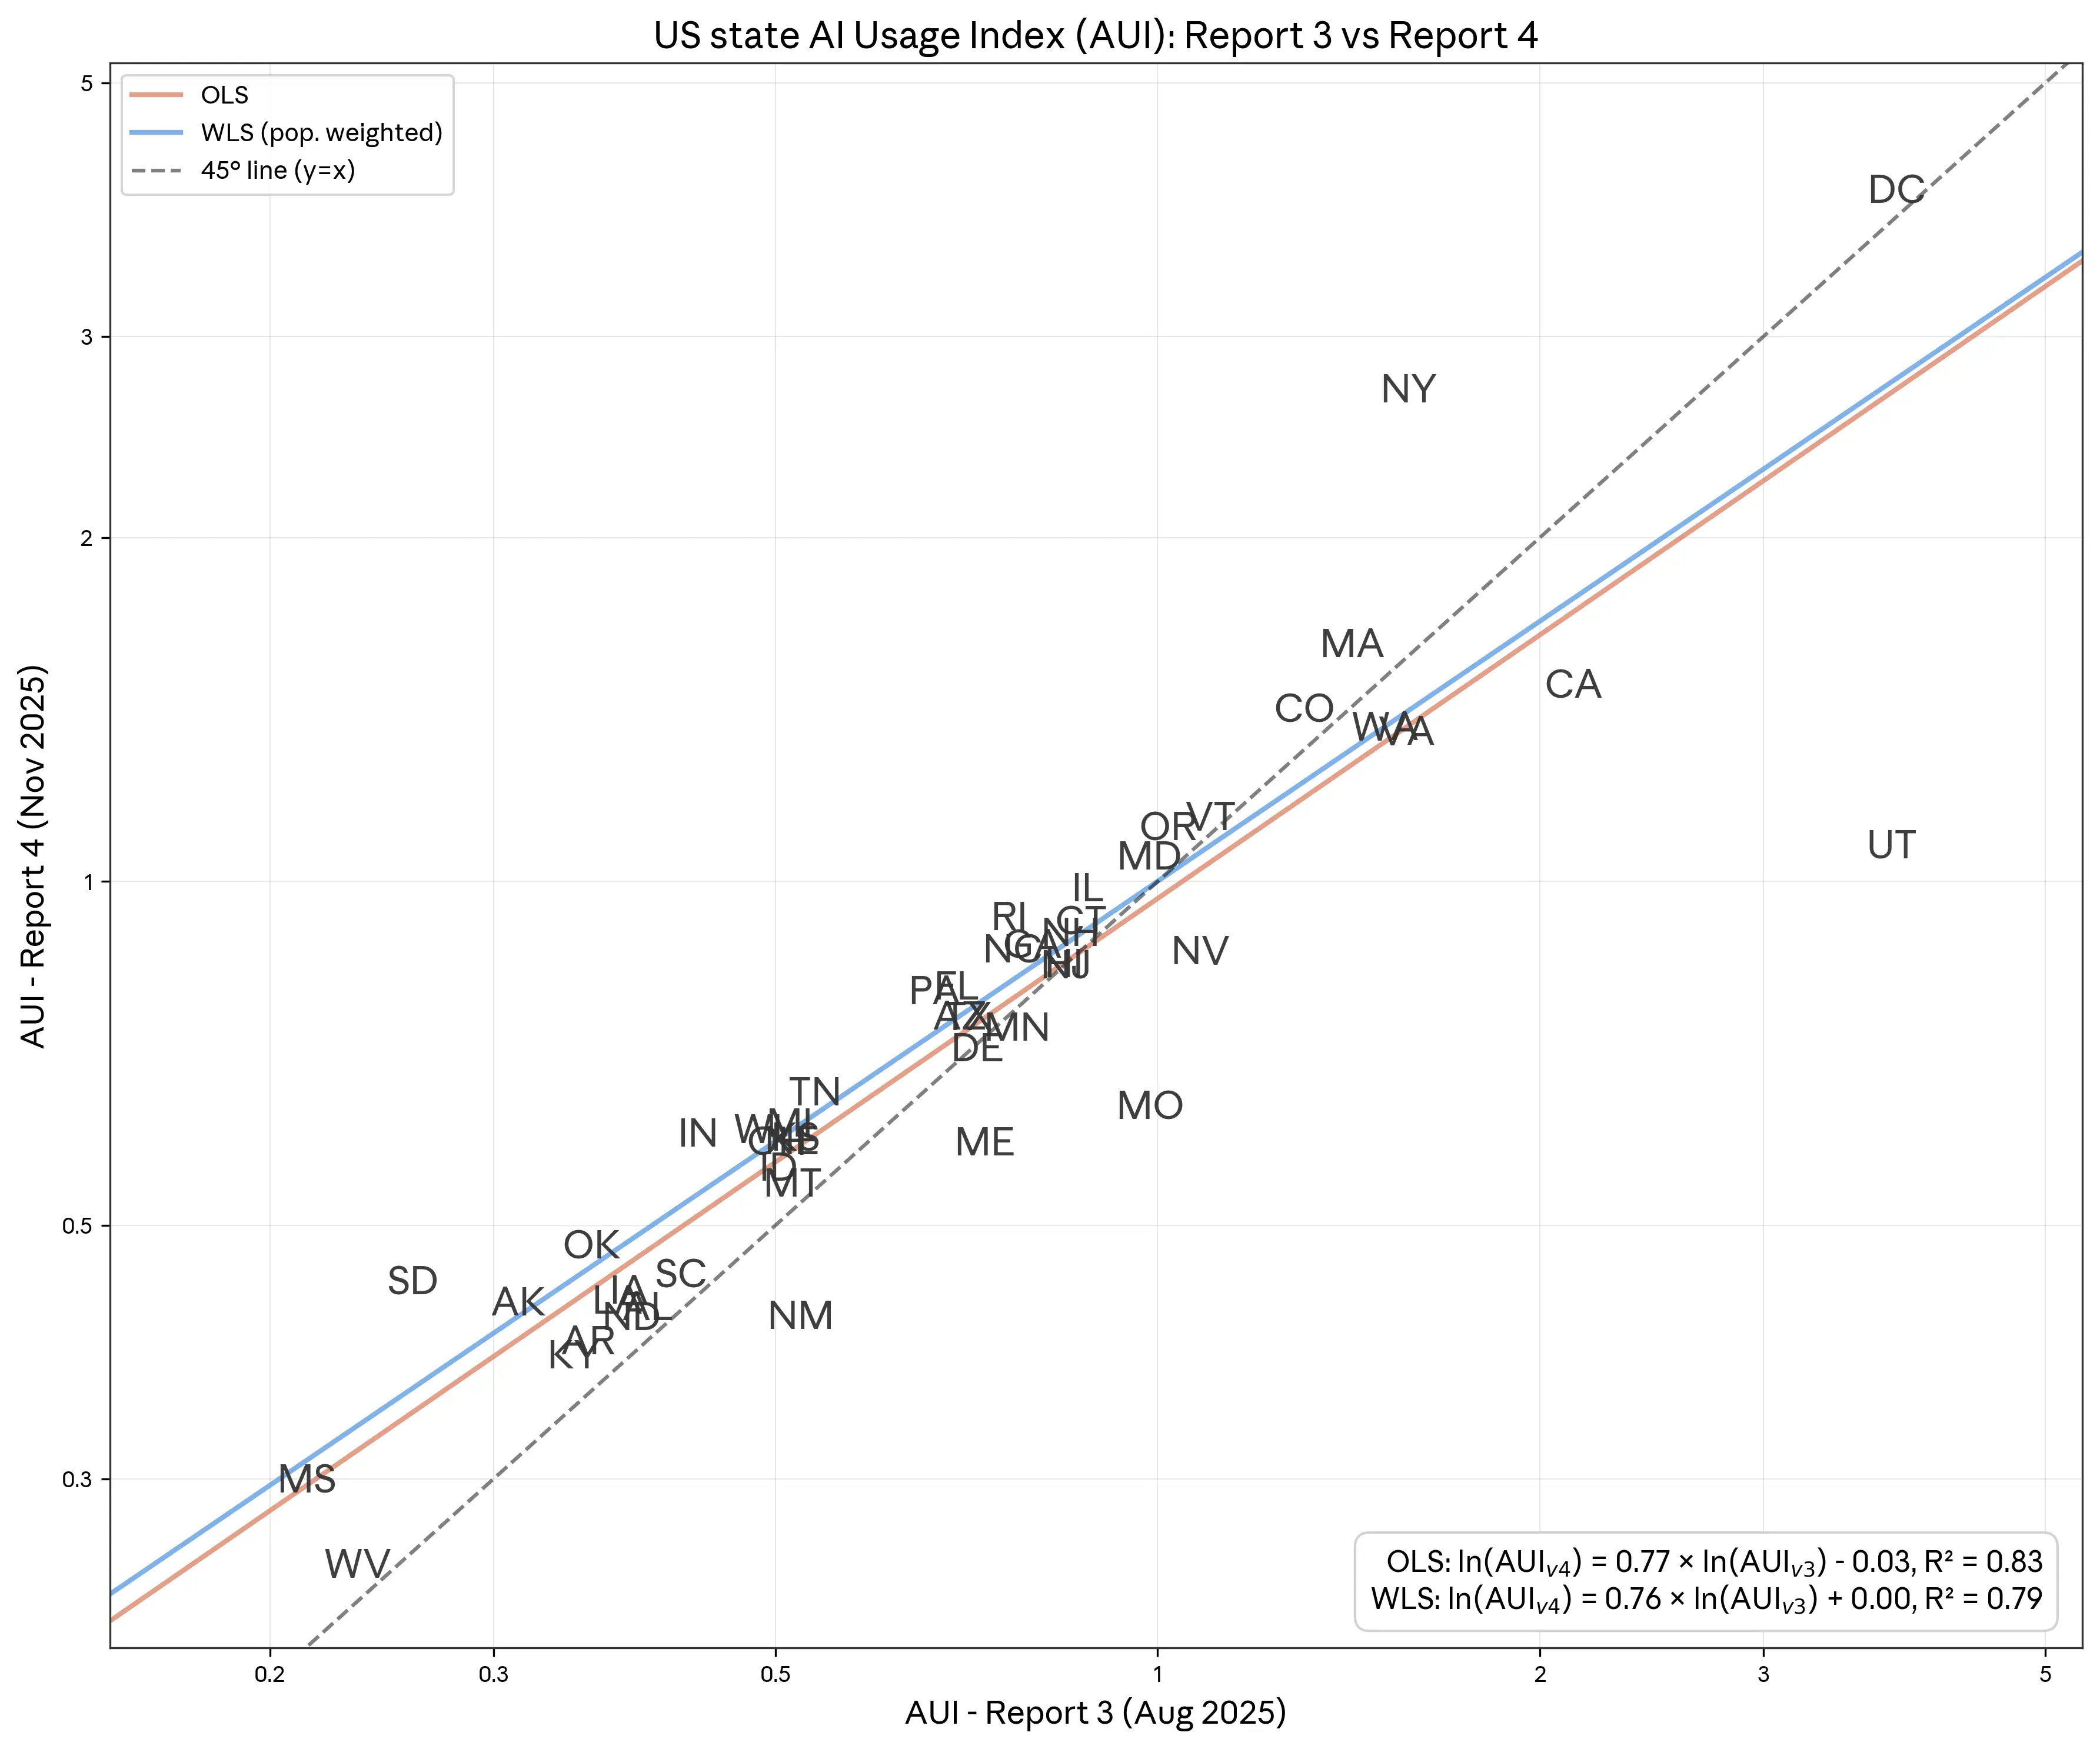
Figure 1.8: Anthropic AI Usage Index (AUI) across the US, August 2025 (V3) and November 2025 (V4). 图 1.8:2025 年 8 月(V3 版)和 2025 年 11 月(V4 版)美国各州 Anthropic AI 使用指数(AUI)。 By comparing the AUI in November 2025 with its value in August 2025 we can estimate the implied rate of diffusion of Claude usage within the US. Under a model of proportional convergence toward a steady state in which AUI = 1 for all US states, the estimated elasticity can be used to calculate the pace of diffusion (see text for more details). Our range of estimates implies a pace of regional convergence of AUI in 2-5 years. 通过将 2025 年 11 月的 AUI 与 2025 年 8 月的 AUI 进行比较,我们可以估算出 Claude 在美国境内的隐含使用扩散速率。在一种比例收敛模型下,假设所有美国各州最终都将达到 AUI = 1 的稳态,该模型所估计的弹性可用于计算扩散速度(详见正文)。我们的估计范围表明,AUI 的区域收敛速度大约为 2 至 5 年。
A concern with estimating convergence this way is that our AUI estimates are subject to sampling noise and other variation unrelated to diffusion. This can produce classical attenuation bias: even if AUI is not actually changing, our estimate of β could end up meaningfully below one.
采用这种方法估算收敛速度存在一个担忧:我们的 AUI 估计值会受到抽样噪声及其他与扩散无关的变异因素影响。这可能导致经典的衰减偏误(attenuation bias):即使 AUI 实际上并未发生变化,我们对β的估计值仍可能显著低于 1。
To address this, we estimate the model by two-stage least squares (2SLS), instrumenting the log of AUI in August 2025 with the composition of each state’s workforce, measured by its proximity to overall Claude usage patterns. The logic behind this instrument is that workforce composition is a strong predictor of Claude usage (relevance) but being measured independently, is expected to be uncorrelated with sampling noise in our AUI estimates (validity). As noted above, states with more workers in high-Claude-usage roles do tend to have systematically higher usage per capita.
为解决这一问题,我们采用两阶段最小二乘法(2SLS)对模型进行估计,以各州劳动力构成作为工具变量,该构成通过其与整体 Claude 使用模式的接近程度来衡量,并用于预测 2025 年 8 月 AUI 的对数值。该工具变量背后的逻辑在于:劳动力构成是 Claude 使用情况的有力预测指标(相关性),同时由于其独立测量,预期与我们 AUI 估计中的抽样噪声无关(有效性)。如上所述,拥有更多从事高 Claude 使用率岗位的工人的州,其人均使用量确实系统性地更高。
The 2SLS estimates imply modestly slower convergence: β̂ ≈ 0.89 unweighted and β̂ ≈ 0.86 when weighting by each state’s working-age population. However, these estimates are less precise, and only the former is statistically distinguishable from 1 at the 10% level. Despite implying a slower convergence than OLS, the 2SLS estimates still imply rapid diffusion: just four to five years for the log deviation of each state’s AUI to shrink by 90%.
2SLS 估计结果表明收敛速度略慢:未加权时β̂ ≈ 0.89,按各州劳动年龄人口加权后β̂ ≈ 0.86。然而,这些估计的精确度较低,且仅前者在 10%的显著性水平上与 1 存在统计上的显著差异。尽管 2SLS 估计所暗示的收敛速度比普通最小二乘法(OLS)更慢,但仍表明扩散速度很快:各州 AUI 的对数偏差仅需四到五年即可缩小 90%。
That said, our estimates are based on just three months of data. And while the 2SLS specification may help address sampling noise, considerable uncertainty remains. We will revisit this question of the pace of diffusion in future reports.
话虽如此,我们的估算仅基于三个月的数据。尽管两阶段最小二乘法(2SLS)设定可能有助于缓解抽样噪声,但仍然存在较大的不确定性。我们将在未来的报告中重新审视技术扩散速度这一问题。
1 As with previous reports, all our analysis is based on privacy-preserving analysis. Throughout the report we analyze a random sample of 1M conversations from Claude.ai Free, Pro and Max conversations (we also refer to this as “consumer data” since it mostly represents consumer use) and 1M transcripts from our first-party (1P) API traffic (we also refer to this as “enterprise data” since it mostly represents enterprise use). Both samples come from November 13, 2025 to November 20, 2025. We continue to manage data according to our privacy and retention policies, and our analysis is consistent with our terms, policies, and contractual agreements. For 1P API data, each record is a prompt-response pair from our sample period which in some instances is mid-session for multi-turn interactions.
1 与以往报告一样,我们所有的分析均基于隐私保护型分析方法。本报告中,我们分析了从 Claude.ai Free、Pro 和 Max 用户对话中随机抽取的 100 万条对话样本(由于主要代表消费者使用,我们也称其为“消费者数据”),以及从我们第一方(1P)API 流量中抽取的 100 万条对话记录(由于主要代表企业使用,我们也称其为“企业数据”)。两个样本的时间范围均为 2025 年 11 月 13 日至 2025 年 11 月 20 日。我们继续按照隐私和数据保留政策管理数据,所有分析均符合我们的条款、政策及合同约定。对于 1P API 数据,每条记录均为样本期间内的一组提示-响应对,在某些情况下,这些记录可能来自多轮交互会话的中间部分。
2 The share of conversations on Claude.ai that were classified into neither automation nor augmentation categories fell from 3.9% to 3.0%.
2 在 Claude.ai 上被归类为既非自动化也非增强类别的对话占比从 3.9% 下降至 3.0%。
3 See, for example, Kalanyi et al (2025): “Second, as the technologies mature and the number of related jobs grows, hiring spreads geographically. This process is very slow, taking around 50 years to disperse fully.”
3 参见例如 Kalanyi 等人(2025)的研究:“其次,随着技术的成熟及相关岗位数量的增加,招聘活动在地理上逐渐扩散。这一过程非常缓慢,大约需要 50 年才能完全扩散。”
4 With our bottom-up analysis of 1P API traffic we see Claude used to “Generate personalized B2B cold sales emails” (0.47%), “Analyze emails and draft replies for business correspondence” (0.28%), “Build and maintain invoice processing systems” (0.24%), “Classify and categorize emails into predefined labels” (0.23%), and “Manage calendar scheduling, meeting coordination, and appointment booking” (0.16%).
4 通过对 1P API 流量的自下而上分析,我们发现 Claude 被用于“生成个性化 B2B 销售冷邮件”(0.47%)、“分析邮件并起草商务往来回复”(0.28%)、“构建和维护发票处理系统”(0.24%)、“将邮件分类并归入预定义标签”(0.23%)以及“管理日程安排、会议协调和预约预订”(0.16%)。
5 At a high level, we distinguish between automation and augmentation modes of using Claude. Automation encompasses interaction patterns focused on task completion: Directive: Users give Claude a task and it completes it with minimal back-and-forth; Feedback Loops: Users automate tasks and provide feedback to Claude as needed; Augmentation focuses on collaborative interaction patterns: Learning: Users ask Claude for information or explanations about various topics; Task Iteration: Users iterate on tasks collaboratively with Claude; Validation: Users ask Claude for feedback on their work
5 在宏观层面上,我们将使用 Claude 的方式区分为自动化模式与增强模式。自动化模式涵盖以任务完成为核心的交互模式:指令式——用户向 Claude 分配任务,Claude 以最少的来回交互完成任务;反馈循环——用户自动化执行任务,并在需要时向 Claude 提供反馈。增强模式则聚焦于协作式交互模式:学习——用户向 Claude 询问各类主题的信息或解释;任务迭代——用户与 Claude 协作迭代推进任务;验证——用户请 Claude 对其工作成果提供反馈。.
6 These interaction modes are not mutually exhaustive. In some instances, Claude determines that a sampled conversation does not match any of the five interaction modes.
6 这些交互模式并非完全互斥,也未穷尽所有可能性。在某些情况下,Claude 会判断所采样的对话并不符合上述五种交互模式中的任何一种。
7 In this report we use Sonnet 4.5 for classification whereas in our previous Economic Index report we used Sonnet 4. We previously found that different models can generate different classification outcomes, though these effects tend to be modest.
7 在本报告中,我们使用 Sonnet 4.5 进行分类,而在此前的《经济指数报告》中,我们使用的是 Sonnet 4。我们此前发现,不同模型可能会产生不同的分类结果,但这种影响通常较为有限。
8 We include a constant term in the regression since it should be equal to zero under the null hypothesis. Across all our specifications, the constant term is estimated to be close to and statistically indistinguishable from zero.
8 我们在回归中包含了一个常数项,因为在零假设下该常数项应等于零。在所有模型设定中,所估计的常数项均接近于零,且在统计上与零无显著差异。
Chapter 2: Introducing economic primitives第二章:经济原语简介
The strength of the Anthropic Economic Index lies in showing not only how much AI is used, but how it is used. In prior reports, we showed which tasks Claude is used for, and how people collaborate with Claude. These data have enabled external researchers to analyze labor market shifts (e.g., Brynjolfsson, Chandar & Chen, 2025).
Anthropic 经济指数的优势在于不仅揭示了 AI 的使用程度,还展现了其具体使用方式。在之前的报告中,我们展示了 Claude 被用于哪些任务,以及人们如何与 Claude 协作。这些数据已使外部研究人员得以分析劳动力市场的变化(例如,Brynjolfsson、Chandar 与 Chen,2025)。
In this edition of the Anthropic Economic Index, we expand the breadth of data available to external researchers by providing insights on five economic “primitives”, by which we mean simple, foundational measures of the ways that Claude is used, which we generate by asking Claude to answer specific questions about the anonymized transcripts in our sample. Some of our primitives encompass several such questions, and others use a single indicator.
在本期 Anthropic 经济指数中,我们通过提供关于五个经济“基本要素”(primitives)的洞见,进一步拓展了外部研究人员可获取的数据广度。所谓“基本要素”,是指 Claude 使用方式的简单、基础性度量指标,我们通过让 Claude 回答有关样本中匿名化对话记录的特定问题来生成这些指标。其中一些基本要素包含多个此类问题,另一些则仅使用单一指标。
Because AI capabilities are advancing so rapidly and the economic effects will be unevenly experienced, we need a breadth of signals to uncover not just how Claude is used but also to inform what impact this technology will have.
由于 AI 能力正在飞速发展,且其经济影响将因群体而异,我们需要多维度的信号,不仅揭示 Claude 的使用方式,也帮助我们判断这项技术将产生何种影响。
Dimensions of AI use that matter for economic impacts对经济影响至关重要的 AI 使用维度
This report introduces five new economic primitives beyond the one we already measure, collaboration patterns (whether users automate or augment their tasks with Claude). These primitives capture five dimensions of a human-AI conversation: 1) task complexity, 2) human and AI skills, 3) work, coursework or personal use case, 4) the AI’s level of autonomy, and 5) task success (see Table 2.1). AI autonomy captures something different from our existing automation/augmentation distinction. For example, “Translate this paragraph into French” is high automation (directive, minimal back-and-forth) but low AI autonomy (the task requires little decision-making from Claude).
本报告在我们已衡量的协作模式(用户是用 Claude 自动化任务还是增强任务)之外,引入了五个新的经济原语。这些原语捕捉了人机对话的五个维度:1)任务复杂度,2)人类与 AI 的技能,3)工作、课程作业或个人使用场景,4)AI 的自主程度,以及 5)任务成功度(见表 2.1)。AI 的自主程度与我们现有的自动化/增强区分所捕捉的内容不同。例如,“将这段文字翻译成法语”属于高度自动化(指令明确,几乎无需来回交互),但 AI 的自主程度较低(该任务几乎不需要 Claude 进行决策)。

Table 2.1: Economic primitives added in this report. 表 2.1:本报告新增的经济原语。 The table shows the new economic primitives added in this report, beyond collaboration patterns (automation/augmentation) from prior reports. The first column shows the primitive category, the second column the name of the primitive, and the third column the operationalization of the primitives as the prompts provided to Claude which we use a classifier to map conversations to primitives. See online appendix at https://huggingface.co/datasets/Anthropic/EconomicIndex for full prompt texts. 该表格展示了本报告新增的经济原语,这些原语超出了此前报告中关于协作模式(自动化/增强)的范畴。第一列显示原语类别,第二列显示原语名称,第三列则展示了将这些原语操作化的方式——即提供给 Claude 的提示词,我们利用分类器将对话映射到相应的原语。完整的提示词文本请参见在线附录:https://huggingface.co/datasets/Anthropic/EconomicIndex。
Task complexity captures that tasks can vary in their complexity, including how long they take to complete and how difficult they are. A “debugging” task in O*NET could refer to Claude fixing a small error in a function or comprehensively refactoring a codebase—with very different implications for labor demand. We measure complexity through estimated human time to complete tasks without AI, time spent completing tasks with AI, and whether users handle multiple tasks within a single conversation.
任务复杂度体现了任务在复杂性上的差异,包括完成任务所需的时间长短以及任务本身的难度。“O*NET”中的“调试”任务可能指 Claude 修复函数中的一个小错误,也可能指全面重构整个代码库——这两者对劳动力需求的影响截然不同。我们通过以下方式衡量复杂度:人类在无 AI 辅助下完成任务的预估耗时、使用 AI 完成任务的实际耗时,以及用户是否在单次对话中处理多个任务。
Human and AI skills address how automation interacts with skill levels. If AI disproportionately substitutes for tasks requiring less expertise while complementing higher-skilled work, it could be another form of skill-biased technical change—increasing demand for highly skilled workers while displacing lower skilled workers. We measure whether users could have completed tasks without Claude, and the years of education needed to understand both user prompts and Claude’s responses.
人类技能与 AI 技能探讨了自动化如何与不同技能水平相互作用。如果 AI 不成比例地替代对专业能力要求较低的任务,同时增强高技能工作,这可能构成另一种形式的技能偏向型技术变革——即增加对高技能劳动者的需求,同时排挤低技能劳动者。我们衡量用户是否可以在没有 Claude 的情况下完成任务,以及理解用户提示和 Claude 回复所需接受的教育年限。
Use case distinguishes professional, educational, and personal use. Labor market effects most directly follow from workplace use, while educational use may signal where the future workforce is building AI-complementary skills.
使用场景区分了专业用途、教育用途和个人用途。劳动力市场效应最直接地源于工作场所的使用,而教育用途则可能预示着未来劳动力正在何处培养与 AI 互补的技能。
AI autonomy measures the degree to which users delegate decision-making to Claude. Our latest report documented rising “directive” use where users delegate tasks entirely. Tracking autonomy levels—from active collaboration to full delegation—helps forecast the pace of automation.
AI 自主性衡量用户在多大程度上将决策权委托给 Claude。我们最新报告记录了“指令式”使用(即用户完全委托任务)的上升趋势。追踪自主性水平——从主动协作到完全委托——有助于预测自动化的推进速度。
Task success measures Claude’s assessment of whether Claude completes tasks successfully. Task success helps assess whether tasks can be automated effectively (can a task be automated at all?) and efficiently (how many attempts would it take to automate a task?). That is, task success matters for both the feasibility and the cost of automation labor tasks.
任务成功率衡量的是 Claude 对自身是否成功完成任务的评估。任务成功率有助于判断任务是否能够被有效(即任务是否可以被自动化?)且高效(即自动化一项任务需要多少次尝试?)地实现自动化。换言之,任务成功率关系到自动化劳动任务的可行性与成本。
Selecting and validating the new measures新指标的选取与验证
The new dimensions of AI use captured in our data were informed by our recent work on the productivity effects of Claude, feedback we received from external researchers, recent literature on AI’s economic impact through the lens of human capital and expertise (Vendraminell et al., 2025), and deliberation within our economic research team. Our main selection criteria were expected economic relevance, complementarity of dimensions, and whether Claude could classify conversations along that dimension with directional accuracy.
我们数据中所捕捉的 AI 使用新维度,源于我们近期关于 Claude 生产力效应的研究、外部研究人员提供的反馈、近期通过人力资本与专业技能视角探讨 AI 经济影响的文献(Vendraminelli 等,2025),以及我们经济研究团队内部的深入讨论。我们的主要筛选标准包括:预期的经济相关性、各维度之间的互补性,以及 Claude 是否能以方向性准确性对该维度下的对话进行分类。
We propose that multiple simple primitives, even if somewhat noisy and not perfectly accurate by themselves, can together provide important signals on how AI is being used. We therefore mainly tested for directional accuracy.
我们认为,即使多个简单的基本指标各自存在一定噪声且并非完全准确,它们结合起来仍能提供关于 AI 如何被使用的重要信号。因此,我们主要测试了这些指标的方向性准确性。
For classifying task duration with and without AI, we used minimally modified versions of our prior productivity work. For net new classifiers 1, implemented via our privacy-preserving tooling, our validation process was as follows. We designed multiple potential measures to capture concepts such as task complexity. For Claude.ai, we evaluated the classifier performance compared to a human researcher on a small set of transcripts in which users gave feedback to Claude.ai and for which we thus have permission to look at underlying transcripts. For first-party API (1P API) data, we validate the classifiers using a mix of internal and synthetic data. Neither data sources are fully representative of Claude.ai or 1P API traffic, but they allow us to check that the classifiers are working on data that resembles real usage data, while ensuring privacy.
在对使用和不使用 AI 的任务持续时间进行分类时,我们采用了对我们先前生产力研究工作的最小化修改版本。对于全新的分类器 1 (通过我们的隐私保护工具实现),我们的验证流程如下:我们设计了多种潜在指标,以捕捉任务复杂度等概念。针对 Claude.ai,我们在一小部分用户向 Claude.ai 提供反馈的对话记录上评估了分类器与人工研究员的表现对比;由于我们已获得查看这些底层对话记录的权限,因此可进行此类评估。对于第一方 API(1P API)数据,我们使用内部数据和合成数据的混合方式来验证分类器。这两种数据源均无法完全代表 Claude.ai 或 1P API 的实际流量,但它们使我们能够验证分类器在类似真实使用数据上的有效性,同时确保隐私安全。
Based on initial performance, we revised the classifiers that needed tweaking or discarded classifiers that did not perform well. Interestingly, we find that in some instances (e.g., to measure task success), a simple classifier performed better than a nuanced, complex classifier when compared to human ratings. We then compared performance of classifier versions with vs. without chain of thought prompting, and decided to keep chain of thought prompting only for three facets (human time estimate, human with AI time estimate, and AI autonomy) where we found that it substantially improved performance. We selected a final set of nine new classifiers for the five primitives, all of which are directionally accurate even if they may deviate somewhat from human ratings.
根据初步表现,我们对需要调整的分类器进行了修订,或弃用了表现不佳的分类器。有趣的是,我们发现,在某些情况下(例如衡量任务成功与否),与人类评分相比,简单的分类器反而比复杂精细的分类器表现更佳。随后,我们比较了使用思维链提示(chain of thought prompting)与不使用该提示的分类器版本的表现,并决定仅在三个维度(人类耗时估计、人类结合 AI 的耗时估计和 AI 自主性)保留思维链提示,因为在这三个方面它显著提升了性能。最终,我们为五个经济原语(primitives)选定了一组共九个新分类器,这些分类器在方向上都是准确的,即使它们可能在一定程度上与人类评分存在偏差。
The primitives’ value is in what they can predict这些原语的价值在于其预测能力
Our goal was to create classifiers that are straightforward to implement and in combination provide potentially important economic signals. While we are very confident in the directional accuracy of the new measures (e.g., tasks with higher average years of education needed to understand the human prompt are likely more complex), none of the measures should be taken as exact or definitive (e.g., Claude.ai may somewhat underestimate the human education years needed for many tasks).
我们的目标是创建一些易于实施的分类器,这些分类器组合起来可提供潜在的重要经济信号。尽管我们对新指标的方向性准确性非常有信心(例如,理解人类提示所需平均受教育年限越高的任务,其复杂性可能也越高),但这些指标都不应被视为精确或确定的(例如,Claude.ai 可能会略微低估许多任务所需的人类教育年限)。
Even so, the primitives enrich our understanding of how people use AI. Systematic relationships emerge across primitives, regions, and tasks—patterns we explore in depth in Chapters 3 and 4. That these relationships are intuitive and consistent suggests the primitives capture relevant aspects of how people and businesses use Claude.
尽管如此,这些基础指标仍丰富了我们对人们如何使用人工智能的理解。在基础指标、地区和任务之间呈现出系统性的关联——这些模式我们在第 3 章和第 4 章中进行了深入探讨。这些关联具有直观性和一致性,表明这些基础指标确实捕捉到了人们和企业使用 Claude 的相关方面。
External benchmarks reinforce this. In our productivity work, Claude’s time estimates correlate with actual time spent on software engineering tasks. Figure 2.1 shows that our human education measure correlates with actual worker education levels across occupations. These validations suggest individual primitives are directionally correct—and combining them may provide additional analytical value, such as enriching productivity estimates with task success rates or constructing new measures of occupational exposure.
外部基准测试进一步佐证了这一点。在我们的生产力研究中,Claude 对软件工程任务所花费时间的预估与实际耗时高度相关。图 2.1 显示,我们基于人类教育水平的衡量指标与各职业中从业者的实际教育水平也存在相关性。这些验证表明,各个经济原语在方向上是正确的——将它们结合起来或许能提供额外的分析价值,例如用任务成功率来丰富生产力估计,或构建衡量职业暴露程度的新指标。
Ultimately, the strongest validation will come from the primitives’ ability to capture meaningful variation in labor market outcomes. The data we release enable external researchers to analyze economic shifts in new ways. Early work has been encouraging—the automation/augmentation distinction from prior reports has already been used by external researchers to analyze labor market shifts (Brynjolfsson, Chandar & Chen, 2025).
最终,最有力的验证将来自这些原语能否有效捕捉劳动力市场结果中的有意义差异。我们发布的数据使外部研究人员能够以全新方式分析经济变化。早期的研究成果令人鼓舞——此前报告中提出的“自动化/增强”区分已被外部研究者用于分析劳动力市场变化(Brynjolfsson, Chandar & Chen, 2025)。
Primitives highlight how use cases differ原语突显了不同用例之间的差异
To illustrate how the primitives distinguish between different types of AI use, we examine two contrasting request clusters: software development (“Help debug, develop, and optimize software across multiple programming domains”) and personal life management (“Assist with personal life management and everyday tasks”). Figure 2.2 shows the primitive profile for each cluster alongside global averages.
为说明这些经济原语如何区分不同类型的 AI 使用,我们考察了两个对比鲜明的请求集群:软件开发(“帮助在多个编程领域中调试、开发和优化软件”)与个人生活管理(“协助处理个人生活管理和日常任务”)。图 2.2 展示了每个集群的原语特征及其与全局平均值的对比。

Figure 2.2: Descriptive statistics of economic primitives overall and for two example request clusters. 图 2.2:整体及两个示例请求集群的经济原语描述性统计。 For this figure, we focus on descriptive statistics for the primitives across the whole Claude.ai sample as well as two request clusters at the lowest level of granularity. N indicates the overall count of conversations or the count of conversations belonging to the request clusters. 在本图中,我们聚焦于 Claude.ai 整个样本中经济原语的描述性统计,以及在最细粒度层级上的两个请求集群。N 表示对话的总数量,或属于各请求集群的对话数量。
Task complexity. Claude estimates that software development requests would take a competent professional approximately 3.3 hours to complete without AI—close to the global average of 3.1 hours. Personal life management tasks are estimated to be simpler, averaging 1.8 hours. Estimated human-AI collaboration time is similar across both (~15 minutes), showing this primitive varies less than other primitives for these two tasks.
任务复杂度。Claude 估计,软件开发类请求在不使用 AI 的情况下,一名合格的专业人士大约需要 3.3 小时完成——接近全球平均的 3.1 小时。个人生活管理类任务则被认为更简单,平均耗时 1.8 小时。两类任务在人机协作下的预计耗时相近(约 15 分钟),表明在这些任务中,该指标的差异小于其他指标。
Human and AI skills. Software development requests draw on more specialized knowledge: both human prompts and AI responses are estimated to require approximately 13.8 years of education to understand, compared to 9.1–9.4 years for personal life management requests. Claude estimates that users would be able to complete personal life management requests by themselves 96% of the time, versus 82% for software development requests—indicating that Claude provides more essential support for technical work.
人类与 AI 所需技能。软件开发类请求涉及更专业的知识:据估计,无论是人类提问还是 AI 回答,理解相关内容均需约 13.8 年的教育背景;而个人生活管理类请求则仅需 9.1 至 9.4 年。Claude 估计,用户在 96%的情况下能够独立完成个人生活管理类请求,而软件开发类请求的独立完成率仅为 82%——这表明 Claude 在技术性工作中提供了更为关键的支持。
Use case. Claude classifies 64% of software development requests as work-related, compared to just 17% for personal life management. This illustrates that Claude can be used for very different purposes. Overall, Claude.ai use is 46% work, 19% coursework, and 35% personal.
使用场景。Claude 将 64% 的软件开发请求归类为与工作相关,而个人生活管理类请求仅占 17%。这表明 Claude 可用于截然不同的用途。总体而言,Claude.ai 的使用中,46% 用于工作,19% 用于课程作业,35% 用于个人事务。
AI autonomy. Both clusters show similar estimated autonomy levels (~3.5 on a 1 to 5 scale), near the global average. This means that both software development and personal life management tasks, on average, afford Claude a similar autonomy to make decisions on how to complete the task.
AI 自主性。两个类别(软件开发与个人生活管理)的估计自主性水平相近(在 1 到 5 分的量表上约为 3.5 分),接近全球平均水平。这意味着,在平均而言,Claude 在执行软件开发任务和个人生活管理任务时,拥有相似程度的自主决策权来决定如何完成任务。
Task success. Claude assesses personal tasks as successfully completed 78% of the time, versus 61% for software development. Harder tasks—those requiring more specialized knowledge and where users could not easily complete them alone—show lower estimated success rates.
任务成功率。Claude 评估个人任务的成功完成率为 78%,而软件开发任务为 61%。那些更困难的任务——即需要更多专业知识、用户难以独立完成的任务——其估计成功率较低。
Tasks and primitives differ between Claude.ai and API usersClaude.ai 用户与 API 用户在任务类型和基本操作上存在差异
As in our previous report, we find major differences in the tasks and primitives in Claude.ai conversations compared to the 1P API data. Part of this reflects the nature of the interaction: Claude.ai transcripts can include multi-turn conversations, while the API data we analyze is limited to single input-output pairs. This is because API requests arrive independently, with no metadata linking them to prior exchanges. This means we can only analyze them as isolated user-assistant pairs rather than full conversation trajectories.
与我们之前的报告一样,我们发现 Claude.ai 对话中的任务和原语与 1P API 数据存在显著差异。部分原因在于交互性质的不同:Claude.ai 的对话记录可能包含多轮对话,而我们分析的 API 数据仅限于单次输入-输出对。这是因为 API 请求是独立到达的,没有元数据将其与之前的交互关联起来。这意味着我们只能将它们作为孤立的用户-助手交互对进行分析,而无法还原完整的对话轨迹。
Overall, API usage is overwhelmingly work-related (74% vs. 46%) and directive (64% vs. 32%), with three-quarters of interactions classified as automation compared to less than half on Claude.ai (see Figure 1.3).
总体而言,API 使用场景绝大多数与工作相关(74% 对比 46%)且具有指令性(64% 对比 32%),其中四分之三的交互被归类为自动化任务,而在 Claude.ai 上这一比例不到一半(见图 1.3)。
Claude.ai users, by contrast, engage in more back-and-forth: task iteration and learning modes are far more common, and tasks tend to be more lengthy—both in terms of human time with AI (15 minutes vs. 5 minutes) and the estimated time a human would need to complete the task alone (3.1 hours vs. 1.7 hours). Claude.ai also shows higher task success rates (67% vs. 49%), which may reflect the benefits of multi-turn conversation, where users can clarify, correct course, and iterate toward a solution. Claude.ai users also give the AI more autonomy on average, and are more likely to bring tasks they couldn’t complete alone.
相比之下,Claude.ai 用户更倾向于进行多轮交互:任务迭代和学习模式更为常见,且任务通常更耗时——无论是用户与 AI 交互的时间(15 分钟 vs. 5 分钟),还是人类独立完成该任务所需的预估时间(3.1 小时 vs. 1.7 小时)均如此。Claude.ai 的任务成功率也更高(67% vs. 49%),这可能体现了多轮对话的优势,用户可在对话中不断澄清、调整方向,并逐步迭代出解决方案。此外,Claude.ai 用户平均赋予 AI 更高的自主权,也更可能带来那些他们无法独自完成的任务。
These differences are also reflected in the occupational distribution of tasks. API usage is heavily concentrated in Computer & Mathematical tasks (52% vs. 36%), consistent with its use for programmatic, automation-friendly workflows like code generation and data processing. Office & Administrative tasks are also more prevalent in the API (15% vs. 8%), reflecting routine business operations suited to delegation. Claude.ai, by contrast, sees substantially more Educational Instruction tasks (16% vs. 4%)—coursework help, tutoring, and instructional material development—as well as more Arts, Design, and Entertainment tasks (11% vs. 6%). Claude.ai also has a longer tail of human-facing categories like Community & Social Service and Healthcare Practitioners, where users seek advice, counseling, or information on personal matters.
这些差异也体现在任务的职业分布上。API 的使用高度集中于计算机与数学类任务(52% 对比 36%),这与其用于编程化、适合自动化的流程(如代码生成和数据处理)相一致。办公室与行政类任务在 API 中也更为常见(15% 对比 8%),反映出这类常规性业务操作适合委派给自动化系统。相比之下,Claude.ai 上的教育指导类任务显著更多(16% 对比 4%)——包括作业辅导、教学支持以及教学材料开发——同时艺术、设计与娱乐类任务也更多(11% 对比 6%)。此外,Claude.ai 在社区与社会服务、医疗从业者等面向人类交互的长尾类别中也更为活跃,用户在这些场景中寻求建议、咨询或个人事务相关信息。
These patterns suggest that 1P API deployments concentrate on tasks amenable to systematic automation, while Claude.ai serves a broader range of use cases including learning, creative work, and personal assistance.
这些模式表明,第一方(1P)API 部署主要聚焦于适合系统化自动化的任务,而 Claude.ai 则服务于更广泛的应用场景,包括学习、创意工作和个人协助。
Chapter 4 explores task-level variation in greater depth.
第四章将更深入地探讨任务层面的差异。
1 A classifier is a model that assigns a given input (e.g. a user conversation) a specific output (e.g. the use case “work”). In this report, we use Claude as a classifier, meaning that we prompt Claude to select a specific output and then use Claude’s response as the output (see Table 2.1 for the prompts).
1 分类器是一种模型,它为给定输入(例如用户对话)分配一个特定输出(例如用例“工作”)。在本报告中,我们使用 Claude 作为分类器,即通过提示 Claude 选择一个特定输出,并将 Claude 的响应作为输出(参见表 2.1 中的提示示例)。
2 Throughout this report, we use binned scatterplots to show bivariate relationships. We divide observations into 20 equally-sized bins based on the x variable, then plot the average x and y values for each bin. The leftmost dot, for example, represents the averages for observations in the lowest 5% of the x distribution.
2 在本报告中,我们使用分箱散点图来展示双变量关系。我们将观测值按 x 变量划分为 20 个等量的箱(bin),然后绘制每个箱中 x 和 y 值的平均值。例如,最左侧的点代表 x 分布最低 5% 区间内观测值的平均值。
Chapter 3: How Claude is used varies by geography第三章:Claude 的使用情况因地区而异
Overview 概述
In this chapter, we analyze geographic variation in Claude usage patterns using a privacy-preserving¹ analysis of 1 million Claude.ai conversations². We make five observations:
本章中,我们基于对 100 万条 Claude.ai 对话的隐私保护¹分析,研究了 Claude 使用模式的地理差异。我们得出以下五点观察结果:
- Claude is mostly used for work, but use cases diversify with adoption: Work and personal use cases are more common in higher-income countries, while coursework use cases are more common in lower-income countries. This echoes findings from our prior report and aligns with recent work by Microsoft.
Claude 主要用于工作场景,但随着采用率提升,其用例呈现多样化趋势:高收入国家更常见工作和个人用途,而低收入国家则更多用于课程作业。这一发现与我们此前报告的结论相呼应,也与 Microsoft 最近的研究结果一致。 - GDP and human education predict adoption globally and within the US: A 1% increase in GDP per capita is associated with a 0.7% increase in Claude usage per capita at the country level. Human education—Claude’s estimate of years of formal education needed to understand the human prompt—correlates positively with the Anthropic AI Usage Index at both levels.
全球及美国国内的采用情况可由 GDP 和人类教育水平预测:在国家层面,人均 GDP 每增加 1%,人均 Claude 使用量就增加 0.7%。人类教育水平——即 Claude 估算的理解人类提示所需接受的正式教育年限——在两个层面上均与 Anthropic AI 使用指数呈正相关。 - Other primitives predict adoption differently at global vs. US levels: At the country level, higher usage correlates with shorter tasks and less AI autonomy. At the US state level, these relationships are not statistically significant, though work use correlates positively with adoption.
其他基础指标在全球层面与美国层面的采用预测方式有所不同:在国家层面,更高的使用频率与更短的任务时长和更低的 AI 自主性相关;而在美国各州层面,这些关系在统计上并不显著,尽管工作用途与采用率呈正相关。 - Relationships between primitives depend on context: Task success is negatively associated with human education across countries, but positively within US states. However, when controlling for other primitives, the US relationship becomes insignificant.
基础指标之间的关系取决于具体情境:在各国之间,任务成功率与人类教育水平呈负相关;但在美国各州内部,二者却呈正相关。然而,在控制其他基础指标后,美国境内的这种正相关关系变得不再显著。 - How humans prompt is how Claude responds: The education levels of human prompts and AI responses are nearly perfectly correlated (r > 0.92 at both levels). Higher per capita usage countries also show more augmentation—using Claude as a collaborator rather than delegating decisions entirely.
人类如何提问,Claude 就如何回应:人类提示的教育水平与 AI 回应的教育水平高度相关(在两个层面上相关系数均超过 0.92)。人均使用频率更高的国家也表现出更强的“增强”特征——即更多地将 Claude 作为协作者,而非完全交由其做决策。
Claude is mostly used for work, but use cases diversify with adoptionClaude 主要用于工作,但随着采用率的提升,其使用场景也日益多样化
Our data, relying on a privacy-preserving 1 analysis of 1 million Claude.ai conversations 2, reveals striking geographic differences in how Claude is adopted. Claude is predominantly used for work, across the globe and across the United States. However, there is geographic variation in use cases. At the global level, the Balkans and Brazil have the highest relative share of work use (see Figure 3.1), and Indonesia stands out with the highest share of coursework. At the US state level, New York stands out as the state using Claude relatively the most for work.
我们的数据基于对 100 万次 Claude.ai 对话的隐私保护型 1 分析 2 ,揭示了 Claude 在不同地区使用方式上的显著差异。在全球范围以及美国国内,Claude 主要被用于工作场景。然而,具体使用场景存在地域差异:在全球层面,巴尔干地区和巴西的工作用途占比最高(见图 3.1),而印度尼西亚则在课程作业用途上占比最高;在美国各州中,纽约州相对而言最常将 Claude 用于工作。
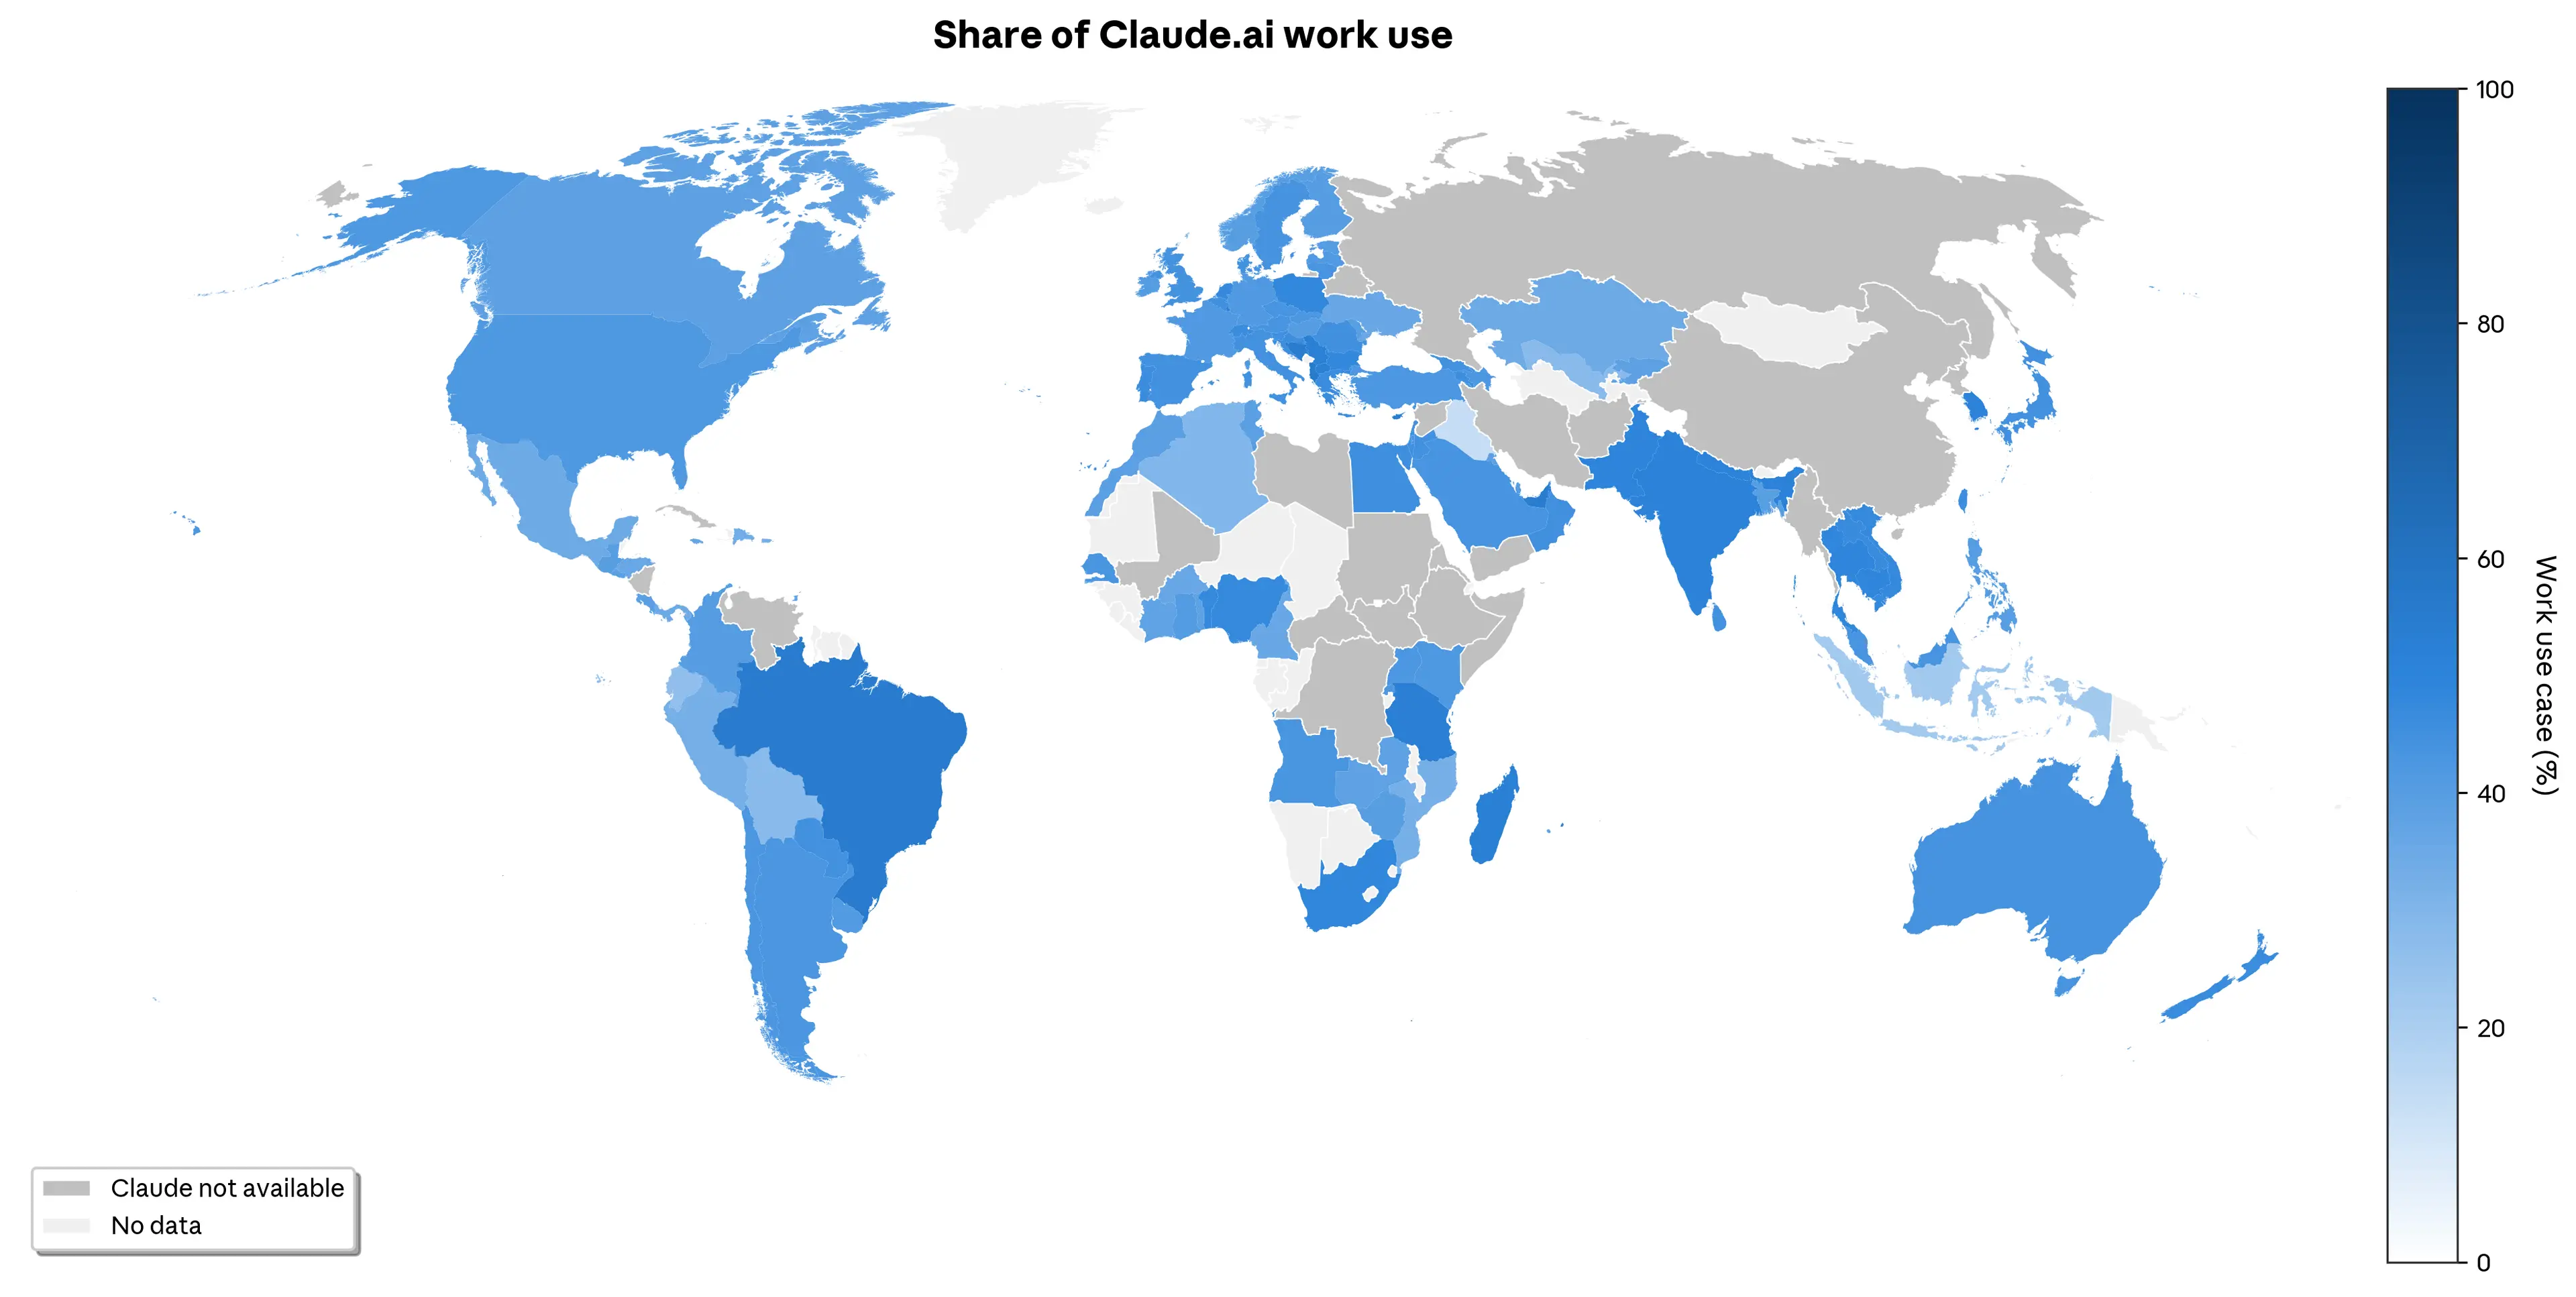
Figure 3.1: Share of work use of Claude.ai globally. 图 3.1:全球范围内 Claude.ai 用于工作的使用比例。 The share of conversations for a given country that are classified as work, as opposed to personal or coursework. The different tiers reflect a country’s position within the global distribution of the Anthropic AI Usage Index as defined in chapter 1 345. We only include countries with at least 200 observations in our sample for this figure because of the uncertainty of the measure for low-usage countries in our random sample. The underlying data includes Claude.ai Free, Pro and Max usage. 针对某一国家,被归类为工作用途(而非个人或课程作业)的对话所占比例。不同层级反映了该国在第一章 所定义的 Anthropic AI 使用指数全球分布中的位置。由于在我们的随机样本中,低使用量国家的测量存在较大不确定性,因此本图仅包含样本中至少有 200 个观测值的国家。基础数据涵盖 Claude.ai 免费版、Pro 版和 Max 版的使用情况。
Use case differences are related to a country’s per capita income, which, in turn, is related to per capita AI adoption. We observe that work use cases and personal use cases of Claude are more common in higher income countries, while coursework use cases are more common in lower income countries (see Figure 3.2). Interestingly, these findings converge with recent work by Microsoft showing that AI use for school is associated with lower per capita income, whereas AI use for leisure is associated with higher per capita income.
使用场景的差异与各国人均收入相关,而人均收入又与人均 AI 采用率相关。我们观察到,在高收入国家,Claude 更多被用于工作和个人用途;而在低收入国家,课程作业用途则更为普遍(见图 3.2)。有趣的是,这一发现与微软近期的研究结果相吻合:用于学习的 AI 使用与较低的人均收入相关,而用于休闲娱乐的 AI 使用则与较高的人均收入相关。
Multiple factors could contribute to these patterns:
多种因素可能共同导致这些模式:
- Personal use cases may be more common as AI adoption increases and more diverse users use AI, or existing users explore wider applications of AI. In contrast, countries with lower per capita adoption (which is correlated with lower per capita income) may be focused on specific use cases such as coding or as coursework.
随着 AI 普及程度的提高,更多样化的用户开始使用 AI,或现有用户探索更广泛的应用场景,这可能导致个人用途更为普遍。相比之下,人均 AI 使用率较低的国家(通常与较低的人均收入相关)可能更集中于特定用途,例如编程或课程作业。 - Countries differ in their ability to pay for Claude, and coursework use cases may be better suited to free Claude usage than complex use cases in work areas such as software engineering.
各国在支付 Claude 费用的能力上存在差异,课程作业等使用场景可能比软件工程等工作领域的复杂用例更适合使用免费版的 Claude。 - Users in higher-income countries may have other resources, such as free time and continuous Internet access, that enable non-essential personal use cases.
高收入国家的用户可能拥有其他资源,例如空闲时间和持续的互联网接入,从而支持非必要的个人使用场景。
International and US adoption differ across economic primitives国际与美国在各项经济基础要素上的采用情况存在差异。
The economic primitives introduced in this report allow us to analyze some of the factors that may drive differential adoption. When analyzing the relationship between the Anthropic AI Usage Index (AUI) and core economic primitives as well as GDP, we observe that certain patterns hold for both countries and US states. For example, we replicate the finding from our prior report that GDP is strongly correlated with the AUI (see Figures 3.3 and 3.4). At the country level, a 1% increase in GDP per capita is associated with a 0.7% increase in Claude usage per capita. Human education (how many years of education it takes to understand the human written prompts in a conversation) correlates positively and significantly with the Anthropic AI Usage Index both at the country and at the US state level.
本报告中引入的经济基本要素使我们能够分析一些可能驱动差异化采用的因素。在分析 Anthropic AI 使用指数(AUI)与核心经济基本要素及 GDP 之间的关系时,我们观察到某些模式在国家和美国各州层面均成立。例如,我们复现了此前报告中的发现:GDP 与 AUI 高度相关(见图 3.3 和图 3.4)。在国家层面,人均 GDP 每增加 1%,人均 Claude 使用量相应增加 0.7%。人力教育水平(即理解对话中人类所写提示所需接受的教育年限)在国家和美国各州层面均与 Anthropic AI 使用指数呈显著正相关。

Figure 3.3: Relationship between the Anthropic AI Usage Index and five core economic primitives and GDP per capita at the country level. 图 3.3:国家层面 Anthropic AI 使用指数与五项核心经济基本要素及人均 GDP 之间的关系。 Each plot shows the bivariate relationship between the natural logarithm of the Anthropic AI Usage Index and a core economic primitive as well as log GDP per capita. Labels show the ISO-3166-1 country codes. We only include countries with at least 200 observations in our sample for this figure because of the uncertainty of the measure for low-usage countries in our random sample. The underlying data includes Claude.ai Free, Pro and Max usage. See chapter 2 for detailed definitions of human only time, human education, AI autonomy, work use case and task success. 每张图展示了 Anthropic AI 使用指数的自然对数与一项核心经济原生变量以及人均 GDP 对数之间的双变量关系。图中标注了 ISO-3166-1 国家代码。由于在我们的随机样本中,低使用量国家的指标存在较大不确定性,因此本图仅包含样本中观测值不少于 200 个的国家。底层数据涵盖 Claude.ai 的 Free、Pro 和 Max 版本的使用情况。关于“纯人工时间”、“人工教育水平”、“AI 自主性”、“工作场景使用”和“任务成功率”的详细定义,请参见第 2 章。

Figure 3.4: Relationship between the Anthropic AI Usage Index and five core economic primitives and GDP per capita at the US state level. Each plot shows the bivariate relationship between the natural logarithm of the Anthropic AI Usage Index and a core economic primitive as well as log GDP per capita. Labels show the ISO-3166-2 region codes 6. We only include states with at least 100 observations in our sample for this figure because of the uncertainty of the measure for low-usage states in our random sample. The underlying data includes Claude.ai Free, Pro and Max usage. See chapter 2 for detailed definitions of human only time, human education, AI autonomy, work use case and task success. 每张图展示了 Anthropic AI 使用指数的自然对数与一项核心经济指标以及人均 GDP 对数之间的双变量关系。图中标注了 ISO-3166-2 地区代码 。由于在我们的随机样本中,低使用量地区的测量存在较大不确定性,因此本图仅包含样本中观测值不少于 100 个的州。底层数据包括 Claude.ai Free、Pro 和 Max 的使用情况。有关“纯人工时间”、“人工教育水平”、“AI 自主性”、“工作场景”和“任务成功率”的详细定义,请参见第 2 章。
However, the relationship between AUI and the primitives often differs between country and US state level. For example, at the country level, the AUI correlates negatively with the time it would take a human to complete a task without AI, and with how much decision-making autonomy AI is given. At the US state level, these relationships are not statistically significant–likely also due to the smaller sample size for US states. Additionally, we observe a positive correlation between the AUI and Claude.ai use for work at the US state, but not at the country level.
然而,AUI 与这些经济原生变量之间的关系在国家层面和美国州层面往往存在差异。例如,在国家层面,AUI 与人类在无 AI 辅助下完成某项任务所需时间以及 AI 被赋予的决策自主程度呈负相关;而在美国州层面,这些关系在统计上并不显著——这可能也与美国各州样本量较小有关。此外,我们观察到在美国州层面,AUI 与 Claude.ai 用于工作场景的使用呈正相关,但在国家层面则未观察到这种相关性。
Importantly, the primitives themselves are not necessarily causal factors—we don’t know if income or education are truly driving adoption, or if they’re proxies for other underlying conditions. Many of these factors are highly correlated with one another. For example, at the US state level, human education years show a strong association with the Anthropic AI Usage Index in isolation, but this relationship disappears once we control for GDP and other primitives—suggesting education may be capturing variation that’s better explained by economic development and other factors.
重要的是,这些基本变量本身并不一定是因果因素——我们并不清楚收入或教育是否真正推动了采用率,还是它们只是其他潜在条件的代理指标。许多这些因素彼此之间高度相关。例如,在美国各州层面,仅看人均受教育年限与 Anthropic AI 使用指数之间存在很强的关联,但一旦我们控制了 GDP 和其他基本变量后,这种关系就消失了——这表明教育可能反映的是由经济发展水平及其他因素更能解释的差异。
Institutional factors shape the relationship between task success and education years制度因素塑造了任务成功率与受教育年限之间的关系
Economic and institutional context—such as how education levels vary within a geography—are related to how AI is being used. Interestingly, we observe that task success is negatively associated with human education at the country level, but positively related at the US state level. However, the positive relationship at the state level becomes insignificant when controlling for other primitives (see Figure 3.5). This means the relationship pattern at one level of observation (country) contradicts the relationship pattern at another level (US state). Cross-country, educated populations may attempt harder tasks and therefore see lower success rates. Within homogeneous contexts, education may not improve task success.
经济与制度背景——例如某一地区内部教育水平的差异——与人工智能的使用方式相关。有趣的是,我们观察到,在国家层面,任务成功率与人类教育水平呈负相关;而在美国州层面,则呈正相关。然而,当控制其他基础变量后,州层面的正相关关系变得不显著(见图 3.5)。这意味着在一种观察层级(国家)上呈现的关系模式,与另一种观察层级(美国州)上的关系模式相矛盾。在跨国比较中,受教育程度较高的人群可能尝试更困难的任务,因此成功率较低;而在相对同质化的环境中,教育水平可能并不会提升任务成功率。

Figure 3.5: Relationship between task success and human education. 图 3.5:任务成功率与人类教育水平之间的关系。 Plots on the left show the bivariate correlation between task success and years of education needed to understand the human prompts in the conversation. Plots on the right show partial regression where we additionally control for GDP per capita, AI autonomy, automation percent, share of work and coursework use cases, human without AI time, human with AI time, multitasking and human ability (see chapter 2 for detailed definitions of these variables). Labels show ISO-3166-1 country codes and ISO-3166-2 region codes. We only include countries with at least 200 and states with at least 100 observations in our sample for this figure because of the uncertainty of the measure for low-usage states in our random sample. The underlying data includes Claude.ai Free, Pro and Max usage. 左侧图表显示了任务成功率与理解对话中人类提示所需受教育年限之间的双变量相关性。右侧图表展示了在控制人均 GDP、AI 自主性、自动化比例、工作与课程使用案例占比、无 AI 时的人类用时、有 AI 时的人类用时、多任务处理程度以及人类能力等因素后的偏回归结果(这些变量的详细定义见第 2 章)。图中标注了 ISO-3166-1 国家代码和 ISO-3166-2 地区代码。由于在我们的随机样本中,低使用量地区的测量存在较大不确定性,因此本图仅包含样本中观测数不少于 200 的国家和观测数不少于 100 的州/地区。底层数据涵盖 Claude.ai 的 Free、Pro 和 Max 版本的使用情况。
How humans prompt is how Claude responds人类如何提问,Claude 便如何回应
We find a very high correlation between human and AI education, i.e. the number of years of education required to understand a human prompt or the AI’s response (countries: r = 0.925, p < 0.001, N = 117; US states: r = 0.928, p < 0.001, N = 50). This highlights the importance of skills and suggests that how humans prompt the AI determines how effective it can be. This also highlights the importance of model design and training. While Claude is able to respond in a highly sophisticated manner, it tends to do so only when users input sophisticated prompts.
我们发现人类与 AI 教育水平之间存在极高的相关性,即理解人类提问或 AI 回答所需受教育的年数(国家层面:r = 0.925,p < 0.001,N = 117;美国各州层面:r = 0.928,p < 0.001,N = 50)。这凸显了技能的重要性,并表明人类如何向 AI 提问决定了 AI 能发挥多大效用。这也突显了模型设计与训练的重要性。尽管 Claude 能够以高度复杂的方式作出响应,但它通常仅在用户输入复杂提示时才会如此。
How models are trained, fine-tuned and instructed affects how they respond to users. For example, one AI model could have a system prompt that instructs it to always use simple language that a middle school student could understand, whereas another AI model may only respond in complex language that would require a PhD education to understand. For Claude, we observe a more dynamic pattern where how the user prompts Claude relates to how Claude responds.
模型的训练方式、微调过程以及所接收的指令会影响其对用户的回应方式。例如,某个 AI 模型可能被设定了一条系统提示,要求其始终使用初中生都能理解的简单语言;而另一个 AI 模型则可能仅以复杂语言作答,需要拥有博士学位的教育背景才能理解。对于 Claude,我们观察到一种更动态的模式:用户如何向 Claude 提问,与其如何回应密切相关。
Higher per capita usage countries, which tend to be higher per capita income countries, show lower automation, and less decision-making autonomy delegated to Claude. That is, higher income countries use AI more as an assistant and collaborator rather than letting it work independently. This relationship is not significant at the US state level, perhaps because income variation and use case diversity are more limited within the United States than globally. This mirrors a finding from our 3rd Economic Index report where countries with higher Anthropic AI Usage Index tend to use Claude in a more collaborative manner (augmentation), rather than letting it operate independently (automation).
人均使用量较高的国家,通常也是人均收入较高的国家,其自动化程度较低,且较少将决策自主权委托给 Claude。也就是说,高收入国家更多地将 AI 用作助手和协作者,而非让其独立工作。这种关系在美国各州层面并不显著,或许是因为美国国内的收入差异和使用场景的多样性相较于全球范围更为有限。这一现象与我们第三期《经济指数报告》中的发现相呼应:Anthropic AI 使用指数较高的国家倾向于以更协作的方式(增强型)使用 Claude,而非让其独立运行(自动化型)。
Conclusion 结论
The striking geographic variation in our data shows that Claude is used in different ways around the world. GDP predicts the Anthropic AI Usage Index at both the country and US state level, and human education—the sophistication of user prompts—correlates with adoption at both levels as well.
我们的数据呈现出显著的地理差异,表明 Claude 在全球各地的使用方式各不相同。无论是在国家层面还是美国各州层面,GDP 都能预测 Anthropic AI 使用指数,而人类教育水平——即用户提示的复杂程度——在这两个层面上也均与 AI 的采用程度相关。
Other relationships depend on context. At the country level, higher usage correlates with shorter tasks and less AI autonomy; within the US, these patterns do not hold. Task success and human education show opposite relationships globally versus within the US.
其他关系则取决于具体情境。在国家层面,更高的使用频率与更短的任务时长和更低的 AI 自主性相关;而在美国国内,这些模式并不成立。任务成功率与人类教育水平之间的关系在全球范围内与在美国国内呈现出相反的趋势。
The near-perfect correlation between human and AI education years underscores that how users prompt Claude shapes how it responds. Combined with the finding that higher-usage countries engage Claude more collaboratively, this suggests that the skills required to use AI well may themselves be unevenly distributed.
人类与 AI 受教育年限之间近乎完美的相关性表明,用户如何向 Claude 提出提示,直接影响了 Claude 的回应方式。结合“高使用率国家更倾向于以协作方式与 Claude 互动”这一发现,这暗示了有效使用 AI 所需的技能本身可能分布不均。
By measuring the characteristics of conversations with Claude, we find important relationships with broader economic factors such as human capital. These relationships may help predict labor market outcomes and inform a smooth transition to an AI-enabled economy that will require different skillsets.
通过衡量与 Claude 对话的特征,我们发现了其与人力资本等更广泛的经济因素之间的重要关联。这些关联有助于预测劳动力市场结果,并为顺利过渡到一个需要不同技能组合的 AI 赋能型经济提供参考。
1 For privacy reasons, our automated analysis system filters out any cells—e.g., countries, and (country, task) intersections—with fewer than 15 conversations and 5 unique user accounts. For bottom-up request clusters, we have an even higher privacy filter of at least 500 conversations and 250 unique accounts.
1 出于隐私考虑,我们的自动分析系统会过滤掉任何对话数量少于 15 次或独立用户账户少于 5 个的单元格——例如国家,以及(国家,任务)的组合。对于自下而上的请求聚类,我们采用了更严格的隐私过滤标准,要求至少包含 500 次对话和 250 个独立用户账户。
2 Data in this section covers 1 million Claude.ai Free, Pro and Max conversations from November 13 to 20, 2025, randomly sampled from all conversations in that period. We then excluded content that was flagged as potential trust and safety violations. The unit of observation is a conversation with Claude on Claude.ai, not a user, so it is possible that multiple conversations from the same user are included, though our past work suggests that sampling conversations at random versus stratified by user does not yield substantively different results. Aggregate geographic statistics at the country and US state level were assessed and tabulated from the IP address of each conversation. For geolocation, we use ISO-3166 codes since our provider for IP geolocation uses this standard. International locations use ISO-3166-1 country codes, US state level data use ISO-3166-2 region codes, which include all 50 US states and Washington DC. We exclude conversations originating from VPN, anycast, or hosting services, as determined by our IP geolocation provider.
本节数据涵盖 2025 年 11 月 13 日至 20 日期间从 Claude.ai 平台所有对话中随机抽取的 100 万条 Claude.ai 免费版、Pro 版和 Max 版对话。随后,我们排除了被标记为潜在信任与安全违规的内容。观察单位为用户在 Claude.ai 上与 Claude 的单次对话,而非用户本身,因此同一用户可能包含多条对话记录;不过我们以往的研究表明,随机抽样对话与按用户分层抽样所得结果在实质上并无显著差异。国家及美国各州层面的汇总地理统计数据均根据每条对话的 IP 地址进行评估和制表。在地理位置编码方面,我们采用 ISO-3166 标准,因为我们的 IP 地理定位服务提供商遵循此标准:国际位置使用 ISO-3166-1 国家代码,美国各州数据则使用 ISO-3166-2 区域代码(涵盖全部 50 个州及华盛顿特区)。此外,根据 IP 地理定位服务提供商的判定,我们排除了源自 VPN、任播或托管服务的对话。
3 The world map is based on Natural Earth’s world map with the ISO standard point of view for disputed territories, which means that the map may not contain some disputed territories. We note that in addition to the countries shown in gray (“Claude not available”), we do not operate in the Ukrainian regions Crimea, Donetsk, Kherson, Luhansk, and Zaporizhzhia. In accordance with international sanctions and our commitment to supporting Ukraine’s territorial integrity, our services are not available in areas under Russian occupation.
3 世界地图基于 Natural Earth 的世界地图,并采用国际标准化组织(ISO)对争议领土的标准立场,这意味着该地图可能未包含某些争议领土。我们注意到,除了图中以灰色标示的国家(“Claude 不可用”)外,我们在乌克兰的克里米亚、顿涅茨克、赫尔松、卢甘斯克和扎波罗热地区也不开展业务。根据国际制裁措施以及我们支持乌克兰领土完整的承诺,我们的服务在俄罗斯占领区不可用。
4 “No data” applies to countries with partially missing data. Some territories (e.g., Western Sahara, French Guiana) have their own ISO-3611 code. Some of these have some usage, others have none. Since the Anthropic AI Usage Index is calculated per working-age capita based on working age population data from the World Bank, and population data is not readily available for all of these territories, we cannot calculate the AUI for these territories.
4 “无数据”适用于部分数据缺失的国家。一些领土(例如西撒哈拉、法属圭亚那)拥有自己的 ISO 3166-1 代码。其中部分领土存在一定程度的使用,而另一些则完全没有使用。由于 Anthropic AI 使用指数(AUI)是根据世界银行提供的劳动年龄人口数据,按劳动年龄人口人均计算得出,而并非所有这些领土的人口数据都易于获取,因此我们无法为这些领土计算 AUI。
5 We exclude the Seychelles from all geographic analyses because a large fraction of usage we saw during the sampling dates was abusive traffic.
5 我们在所有地理分析中排除了塞舌尔,因为在抽样期间观测到的大量使用流量属于滥用性质。
6 We exclude Wyoming from all US state analyses because a large fraction of usage we saw during the sampling dates was abusive traffic.
6 我们在所有美国各州的分析中排除了怀俄明州,因为在抽样期间我们观察到该州有相当大比例的使用流量属于滥用性质。
Chapter 4: Tasks and productivity第四章:任务与生产力
In this chapter, we examine how time savings, success rates, and autonomy vary across task types, and what this entails for potential impacts on jobs and productivity.
在本章中,我们考察了时间节省、成功率和自主性在不同类型任务中的差异,以及这对就业和生产力可能产生的影响。
The patterns reveal that more complex tasks yield greater time savings, but that this trades off against reliability. In a simple task removal exercise inspired by Autor and Thompson (2025), Claude’s tendency to cover higher-education tasks produces a net deskilling effect across most occupations, as the tasks AI handles are often the more skilled components of a job.
这些模式表明,更复杂的任务能带来更大的时间节省,但这种优势是以可靠性为代价的。在一项受 Autor 和 Thompson(2025)启发的简单任务剔除实验中,Claude 倾向于处理高等教育相关任务,导致大多数职业整体出现技能降级效应,因为 AI 所承担的任务往往是工作中技能要求更高的部分。
Claude usage spans a meaningful fraction of tasks across a growing share of occupations. We incorporate success rates into a richer model of job coverage; some occupations with modest coverage see large effects because AI succeeds on their most time-intensive work. Adjusting productivity estimates for task reliability roughly halves the implied gains, from 1.8 to about 1.0 percentage points of annual labor productivity growth over the next decade. However, these estimates reflect current model capabilities, and all signs suggest that reliability over increasingly long-running tasks will improve.
Claude 的使用已覆盖越来越多职业中相当比例的任务。我们将任务成功率纳入一个更丰富的岗位覆盖模型;某些岗位虽然整体覆盖程度不高,但由于 AI 能够成功完成其最耗时的工作,因此仍能产生显著影响。若根据任务可靠性对生产率估算进行调整,所隐含的收益将大致减半——从未来十年每年提升 1.8 个百分点的劳动生产率增长,降至约 1.0 个百分点。然而,这些估算反映的是当前模型的能力,而所有迹象均表明,AI 在执行越来越长时间任务时的可靠性将持续提升。
Tradeoffs in task acceleration任务加速中的权衡取舍
Our estimates suggest that, in general, the more complex tasks in our data yield a greater time savings (or “speedup”) from AI. We derive this by having Claude estimate both how long a task would take a human working alone and the duration when human and AI work together, which we validated in previous work. Speedup is then the human-alone time divided by the human-with-AI time. So reducing a 1 hour task to 10 minutes would give a 6x speedup.
我们的估算表明,总体而言,数据中越复杂的任务,借助 AI 所节省的时间(即“加速比”)越大。我们通过让 Claude 估算人类单独完成某项任务所需时间,以及人与 AI 协作完成该任务所需时间来得出这一结论——该方法已在我们先前的研究中得到验证。加速比即为人类单独完成时间除以人机协作完成时间。例如,将一项原本耗时 1 小时的任务缩短至 10 分钟,就相当于实现了 6 倍的加速比。
The left panel of Figure 4.1 below gives the average speedup against our core measure of task complexity, the human years of schooling required to understand the inputs, all at the O*NET task level 1. It shows that in Claude.ai conversations, for example, prompts requiring 12 years of schooling (a high school education) enjoy a speedup of 9x, while those requiring 16 years of schooling (a college degree) attain a 12x speedup. This implies that productivity gains are more pronounced for use cases requiring higher human capital, consistent with evidence that white collar workers are far more likely to adopt AI (e.g., Bick et al 2025).
图 4.1 左侧面板展示了在 O*NET 任务层级 1 上,相对于我们衡量任务复杂度的核心指标——理解输入内容所需的人类受教育年限——的平均加速比。例如,在 Claude.ai 对话中,需要 12 年教育(即高中学历)才能理解的提示可获得 9 倍的加速,而需要 16 年教育(即大学学历)的提示则可实现 12 倍的加速。这表明,对于需要更高人力资本的应用场景,生产率提升更为显著,这也与现有证据一致,即白领工作者更有可能采用人工智能(例如 Bick 等,2025 年)。
Throughout the range of task complexity, the speedup is higher for API users. This could reflect the nature of the API data, which is restricted to single-turn interactions, and that API tasks have been specifically selected for automation.
在整个任务复杂度范围内,API 用户的加速比更高。这可能反映了 API 数据的特性:仅限于单轮交互,且 API 任务是专门挑选用于自动化的。

Figure 4.1: Speed up (panel a) and Success rate (panel b) vs. Human years of schooling. 图 4.1:加速比(面板 a)与成功率(面板 b)对比人类受教育年限。 The panel on the left shows a binned scatterplot of the bivariate relationship between speedup and human years of schooling, all measured at the O*NET task level and split by platform. The dashed lines show the fit from a linear regression. The panel on the right shows the same relationship with the success rate in the y-axis. 左侧图表展示了以 O*NET 任务层级衡量的加速比与人力受教育年限之间的双变量关系,按平台分组,并采用分箱散点图呈现。虚线表示线性回归拟合结果。右侧图表展示了相同的关系,但纵轴改为任务成功率。
The results also capture a tradeoff, however. More complex tasks have a lower task success rate, as shown in the panel on the right. On Claude.ai, for example, tasks requiring less than a high school education (e.g., answering basic questions about products) attain a 70% success rate, but this drops to 66% for college-level conversations like developing analysis plans. Still, accounting for the difference in success rates—by either excluding low-success tasks or discounting speedups by success probability—does not eliminate the education gradient: complex tasks still show greater net productivity gains.
然而,结果也揭示了一种权衡关系。如右图所示,更复杂的任务具有较低的任务成功率。例如,在 Claude.ai 平台上,所需教育水平低于高中程度的任务(如回答关于产品的基本问题)可达到 70%的成功率,但在涉及大学水平的对话任务(如制定分析计划)中,成功率则降至 66%。尽管如此,无论是通过剔除低成功率任务,还是根据成功概率对加速比进行折算,这种调整均未消除教育程度梯度:复杂任务仍然展现出更高的净生产率增益。
One way to examine the implications of the education gradient is to look at the share of automation across the education levels required to understand the inputs. If high-education tasks show relatively more automation, it could signal more exposure for white collar workers. Here, though, the message is unclear: the automation share is essentially unrelated to the human levels of education required to write the prompt (Appendix Figure A.1) 2. On both Claude.ai and 1P API, tasks across education levels show automation patterns in roughly equal shares.
考察教育梯度影响的一种方式,是观察不同教育水平所需任务中自动化所占的比例。如果高教育水平的任务显示出相对更高的自动化程度,这可能表明白领工作者面临更大的自动化风险。然而,此处的信号并不明确:自动化比例与撰写提示所需的人类教育水平基本无关(附录图 A.1) 2 。在 Claude.ai 和 1P API 上,不同教育水平的任务所呈现的自动化比例大致相当。
In what contexts do users defer more to Claude? Claude.ai users give the AI slightly more autonomy when working on more complex tasks. In contrast, API usage shows uniformly lower autonomy at all levels of complexity.
用户在哪些情境下更倾向于依赖 Claude?Claude.ai 用户在处理更复杂的任务时,会略微赋予 AI 更高的自主权。相比之下,API 使用场景中,无论任务复杂程度如何,赋予 AI 的自主权普遍较低。

Figure 4.2: AI autonomy vs. human education. 图 4.2:AI 自主权与人类教育水平。 The plot shows a binned scatterplot of the bivariate relationship between AI autonomy and human education required, all measured at the O*NET task level. The dashed lines show the fit from a linear regression. 该图展示了以 O*NET 任务层级为单位,AI 自主权与所需人类教育水平之间的双变量关系的分组散点图。虚线表示线性回归拟合结果。
Note though that these distributions do not span the same set of tasks. API usage covers a more narrow swath of tasks in the economy, as seen in the concentration plot in Chapter 1. The high education tasks that experience heavy usage in the API data include security analysis, testing and quality assurance, and code review, whereas Claude.ai users are more likely to have iterative, instructive sessions.
但需注意,这些分布所涵盖的任务集并不相同。如第一章中的集中度图所示,API 使用覆盖了经济中更为狭窄的一类任务。在 API 数据中使用频率较高的高教育水平任务包括安全分析、测试与质量保证以及代码审查,而 Claude.ai 用户则更可能进行迭代式、指导性的会话。
Task Horizons in Real-World Usage现实世界使用中的任务视野

Figure 4.3: Task success vs. human-only time. The plot shows a binned scatterplot of the bivariate relationship between task success (%) and the time the task would require a human to complete alone, all measured at the O*NET task level and split by platform. The dashed lines show the fit from a linear regression. 图 4.3:任务成功率与纯人工耗时的关系。该图展示了在 O*NET 任务层级上,按平台划分的任务成功率(%)与人类单独完成该任务所需时间之间的双变量关系的分箱散点图。虚线表示线性回归拟合结果。
Recent work on AI “task horizons” (Kwa et al., 2025) finds that AI success rates decline with task duration: longer tasks are harder for models to complete. With each successive model generation, however, this decline has become shallower as models succeed on increasingly long tasks. METR operationalizes task horizon primarily as the maximum duration at which a model achieves at least 50% success, and growth in this metric has become a key indicator of AI progress.
近期关于 AI“任务时长边界”(Kwa 等,2025)的研究发现,AI 的成功率随任务持续时间的延长而下降:任务越长,模型越难以完成。然而,随着每一代新模型的推出,这种下降趋势逐渐变缓,因为模型在越来越长的任务上取得了成功。METR 将任务时长边界主要操作化为模型成功率至少达到 50%时的最大任务时长,该指标的增长已成为衡量 AI 进展的关键标志。
Figure 4.3 shows a similar measure using our primitives. The plot shows task-level success rates against the human time required, all at the O*NET task level. In the API data, success rates drop from around 60% for sub-hour tasks to roughly 45% for tasks estimated to take humans 5+ hours. The fitted line crosses the horizontal 50% success line at 3.5 hours, suggesting that API calls attain a 50% success rate for tasks that are 3.5 hours. The analogous time estimate in METR’s software engineering benchmark is 2 hours for Sonnet 4.5 and about 5 hours for Opus 4.5. (The data in this report predates the release of Opus 4.5.)
图 4.3 使用我们的基本任务单元展示了类似的度量。该图显示了在 O*NET 任务层级上,任务级别的成功率与人类所需时间之间的关系。在 API 数据中,对于耗时不到 1 小时的任务,成功率约为 60%;而对于估计人类需耗时 5 小时以上的任务,成功率则降至约 45%。拟合曲线与 50%成功率的水平线相交于 3.5 小时处,表明通过 API 调用,对于人类需耗时 3.5 小时的任务,AI 可达到 50%的成功率。在 METR 的软件工程基准测试中,Sonnet 4.5 的对应时间估计为 2 小时,而 Opus 4.5 则约为 5 小时。(本报告所用数据早于 Opus 4.5 的发布。)
Claude.ai data tells a different story. Success rates decline far slower as a function of task length. Extrapolating using the linear fit, Claude.ai would hit a 50% success rate at about 19 hours. This may reflect how multi-turn conversation effectively breaks complex tasks into smaller steps, with each turn providing a feedback loop that allows users to correct course.
Claude.ai 的数据讲述了一个不同的故事。其成功率随任务时长增加而下降的速度要慢得多。根据线性拟合进行外推,Claude.ai 的成功率降至 50% 时对应的任务时长约为 19 小时。这可能反映出多轮对话能有效将复杂任务拆解为更小的步骤,每一轮对话都提供了一个反馈循环,使用户能够及时调整方向。
It’s worth noting that a fundamental difference from the METR setting is selection. METR constructs a benchmark where a fixed set of tasks is assigned to models. In our data, users choose which tasks to bring to Claude. This means observed success rates reflect not just model capability but also user judgment about what will work, the cost of setting up the problem for Claude, and the expected time savings if the task succeeds.
值得注意的是,与 METR 设置存在一个根本区别:任务选择方式不同。METR 构建了一个基准测试,其中固定的一组任务被分配给模型;而在我们的数据中,用户自行决定将哪些任务交给 Claude。这意味着观察到的成功率不仅反映模型的能力,也体现了用户对任务可行性的判断、将问题设置给 Claude 所需的成本,以及任务成功后预期节省的时间。
If users avoid tasks they expect to fail, for example, observed success rates will overstate true capability on the full distribution of potential tasks. This selection likely operates on both platforms, but in different ways: API customers select for tasks amenable to automation, while Claude.ai users select for tasks that could benefit from iteration. Also due to this selection effect, there’s no guarantee that more performant models would show improvement in this plot, because users may respond to new models by providing more challenging presentations of otherwise similar O*NET tasks.
如果用户回避那些他们预期会失败的任务,例如,观察到的成功率就会高估模型在全部潜在任务分布上的真实能力。这种选择效应很可能在两个平台上都存在,但表现形式不同:API 客户倾向于选择适合自动化的任务,而 Claude.ai 用户则倾向于选择那些能通过多次迭代获益的任务。同样由于这种选择效应,性能更强的模型在此图中未必会表现出提升,因为用户可能会对新模型提供更具挑战性的任务表述,尽管这些任务本质上与原有的 O*NET 任务相似。
Controlled benchmarks like METR’s measure the frontier of autonomous capability. Our real-world data can measure the effective task horizon, reflecting a mix of model capabilities and user behavior, and expanding beyond coding tasks. Both approaches find that AI can be effective for tasks requiring hours of human work.
像 METR 这样的受控基准测试衡量的是自主能力的前沿水平。而我们的现实世界数据则可以衡量有效任务范围(effective task horizon),这反映了模型能力与用户行为的综合结果,并且超出了编程任务的范畴。两种方法均发现,AI 在需要人类花费数小时完成的任务上已展现出有效性。
Revisiting occupation penetration with effective AI coverage结合有效 AI 覆盖率重新审视职业渗透率
Our earlier work found that 36% of jobs had AI usage for at least a quarter of their tasks, with about 4% reaching 75% task coverage. This measure was based only on the appearance of a task in our data, however. The primitives introduced in this report can help better characterize how AI is changing the work content of occupations.3
我们此前的研究发现,36%的工作岗位中,至少有四分之一的任务使用了人工智能,其中约 4%的工作岗位达到了 75%的任务覆盖率。然而,这一衡量标准仅基于任务是否出现在我们的数据中。本报告引入的“经济原语”(primitives)有助于更准确地描述人工智能如何改变各类职业的工作内容。 3
First, we find that task coverage is increasing. Combining across reports, 49% of jobs have seen AI usage for at least a quarter of their tasks. But incorporating that task’s share of the job, and Claude’s average success rate, suggests a different set of affected occupations.
首先,我们发现任务覆盖率正在上升。综合各份报告的数据,49%的工作岗位中,至少有四分之一的任务使用了人工智能。但若进一步考虑每项任务在整体工作中的占比,以及 Claude 的平均成功率,则会得出一组不同的受影响职业。
We define effective AI coverage as the percent of a worker’s day that can be performed successfully by Claude. It’s calculated as the weighted sum of task success rates, where each task’s weight is its share of the worker’s time adjusted by how frequently the task occurs. The success rate comes from our primitives, the hours estimate from our previous work on productivity effects, and the frequency estimate from O*NET data, where surveyed workers indicate how often they perform the task.
我们将“有效 AI 覆盖率”定义为 Claude 能够成功完成的员工日工作时长所占的百分比。该指标通过加权计算各项任务的成功率得出,其中每项任务的权重为其在员工工作时间中所占比例,并根据任务执行频率进行调整。任务成功率来自本报告提出的“原语”评估,工时估算来自我们此前关于生产力影响的研究,而任务频率则依据 O*NET 数据库中的数据——该数据由受访员工报告其执行各项任务的频率。
The plot below shows how the effective AI coverage (y-axis) differs from task coverage alone (x-axis). The two are highly correlated, but with key differences. On the right side of the plot, occupations with high coverage—where almost all tasks appear with some frequency in Claude data—generally fall below the 45-degree line. This suggests that even 90% task coverage does not necessarily indicate large job impacts, since Claude may fail on key covered tasks or miss the most time-intensive ones.
下图展示了有效 AI 覆盖率(纵轴)与单纯的任务覆盖率(横轴)之间的差异。两者高度相关,但存在关键区别。在图的右侧,任务覆盖率较高的职业——即几乎所有任务在 Claude 数据中都以一定频率出现——通常落在 45 度线以下。这表明,即使任务覆盖率达到 90%,也未必意味着对工作产生重大影响,因为 Claude 可能在某些关键的已覆盖任务上失败,或遗漏了耗时最多的工作。
Zooming in, several occupations show large differences in effective AI coverage compared to task coverage. For example, data entry workers have one of the highest effective AI coverage. This is because although only two of their nine tasks are covered, their largest task—reading and entering data from source documents—has high success rates with Claude. AI excels at what they spend most of their time doing.
放大来看,一些职业在有效 AI 覆盖率与任务覆盖率之间存在显著差异。例如,数据录入员的有效 AI 覆盖率位居前列。这是因为尽管他们九项任务中仅有两项被覆盖,但其中最主要的任务——从源文件中读取并输入数据——Claude 的成功率很高。AI 擅长处理他们花费最多时间的工作。
Medical transcriptionists and radiologists also move up because their covered tasks happen to be their most time-intensive and highest-frequency work. For radiologists, their top two tasks— interpreting diagnostic images and preparing interpretive reports—have high success rates. These occupations have low task coverage because AI can’t do the hands-on or administrative work in their job profiles, but it succeeds on the core knowledge work that dominates their workday.
医学转录员和放射科医生的排名也有所上升,因为 AI 所覆盖的任务恰好是他们最耗时且频率最高的工作。对于放射科医生而言,其前两大任务——解读诊断影像和撰写解读报告——具有很高的成功率。这些职业的任务覆盖率较低,是因为 AI 无法完成其工作中涉及的动手操作或行政事务,但在占据其工作日主导地位的核心知识型任务上,AI 表现优异。
Microbiologists fall below the 45-degree line, suggesting lower effective AI coverage than would be predicted by task coverage alone. Claude covers half of their tasks, but not their most time-intensive: hands-on research using specialized lab equipment.
微生物学家则位于 45 度线以下,表明其有效 AI 覆盖率低于仅基于任务覆盖率所预测的水平。Claude 虽然覆盖了他们一半的任务,但并未覆盖其最耗时的任务——使用专业实验室设备进行的实操研究。
This measure arguably gives a more realistic picture of job-level AI penetration. However, its implications depend on how often these Claude conversations actually displace or augment work that would otherwise be done by humans. For data entry clerks, AI likely does substitute for tasks previously performed manually. But when a Claude conversation maps to a teacher performing a lecture, it is less clear how this translates to reduced lecture time on the job. In future work, we could leverage our 1P API data to understand which of these tasks are being integrated into production workflows.
这一衡量指标可以说能更真实地反映人工智能在岗位层面的渗透情况。然而,其实际影响取决于这些 Claude 对话在多大程度上真正取代或增强了原本由人类完成的工作。对于数据录入员而言,人工智能很可能替代了以往手动执行的任务;但当一次 Claude 对话对应于教师进行授课时,这种使用是否意味着教师在工作中实际授课时间的减少就不太明确。在未来的研究中,我们可以利用我们的第一方 API 数据,来了解这些任务中有多少已被整合进实际的生产工作流中。
AI’s impact on the task content of jobs人工智能对工作岗位任务内容的影响
Beyond how much of a worker’s day AI can successfully perform, a separate question is which tasks get covered, and whether those tend to be the high-skill or low-skill components of the job. Recent research has studied changes in the task mix within jobs to understand AI’s impact on wages and employment (Autor and Thompson 2025; Hampole et al 2025). A key insight is that automation’s effects depend not just on how many tasks are covered, but on which tasks.
除了人工智能能在多大程度上完成员工一天中的工作之外,另一个问题是:哪些具体任务被覆盖了?这些任务通常是岗位中的高技能部分还是低技能部分?近期研究通过分析岗位内部任务构成的变化,以理解人工智能对工资和就业的影响(Autor 和 Thompson,2025;Hampole 等,2025)。其中一项关键发现是,自动化的效应不仅取决于被覆盖任务的数量,更取决于被覆盖的是哪些任务。
To see how jobs change when we remove the tasks AI can perform, we first construct a measure of the level of skill required for each task. O*NET doesn’t provide task-level education requirements, so we train a model that predicts years of schooling from task embeddings, using the BLS’s occupation-level education as the target 4. This way, a low-education occupation may still have a high-skill task if it looks like those that tend to exist in high-education occupations. For example, Legal Secretaries is a 12-year education occupation, but the task “Review legal publications and perform database searches to identify laws and court decisions relevant to pending cases” is predicted to require 17.7 years because it resembles tasks typically performed by lawyers and paralegals.
为了观察当我们移除 AI 可执行的任务后,工作岗位会发生怎样的变化,我们首先构建了一个衡量每项任务所需技能水平的指标。O*NET 并未提供任务层面的教育要求,因此我们训练了一个模型,利用劳工统计局(BLS)提供的职业层面教育数据作为目标 4 ,从任务嵌入中预测完成该任务所需的受教育年限。通过这种方法,即使某个职业整体所需的教育年限较低,其中仍可能包含高技能任务,只要该任务与高教育年限职业中常见的任务相似。例如,“法律秘书”这一职业对应的平均教育年限为 12 年,但其中一项任务“查阅法律出版物并执行数据库搜索,以识别与待决案件相关的法律和法院判例”被预测需要 17.7 年的教育年限,因为该任务与律师和律师助理通常执行的任务相似。
The data shows that Claude tends to cover tasks that require higher levels of education. The mean predicted education for tasks in the economy is 13.2 years. For tasks that we see in our data, the mean prediction is about a year higher, 14.4 years (corresponding to an Associate’s degree). This aligns with the occupation-level results from earlier reports, showing more Claude usage among white collar occupations.
数据显示,Claude 倾向于覆盖那些需要更高教育水平的任务。在整个经济中,各项任务所需的平均预测教育年限为 13.2 年;而在我们数据中观察到的任务,其平均预测值则高出约一年,达到 14.4 年(相当于副学士学位)。这与早期报告中的职业层面结果一致,表明白领职业中 Claude 的使用更为普遍。

Figure 4.5: Education level of all tasks vs. Claude-covered tasks 图 4.5:所有任务与 Claude 覆盖任务的教育水平对比 This shows two histograms. The blue bars give the distribution of the predicted task-level education required for all tasks in the O*NET database, weighted by employment. The orange bars show the same, restricting to tasks that appear in Claude.ai data. 该图展示了两个直方图。蓝色柱状图表示 O*NET 数据库中所有任务按就业人数加权后的任务级所需教育年限预测分布;橙色柱状图则仅限于出现在 Claude.ai 数据中的任务,展示相同的分布情况。
We next calculate how removing AI-covered tasks shifts the average education level of what remains. Overall, the net first-order impact is to deskill jobs, since AI removes tasks that require relatively higher levels of education. One job that experiences such deskilling is technical writers, which loses tasks like “Analyze developments in specific field to determine need for revisions” (18.7 years) and “Review published materials and recommend revisions or changes in scope, format” (16.4 years), leaving tasks like “Draw sketches to illustrate specified materials” (13.6 years) and “Observe production, developmental, and experimental activities” (13.5 years). Travel agents also experience deskilling because AI covers tasks like “Plan, describe, arrange, and sell itinerary tour packages” (13.5 years) and “Compute cost of travel and accommodations” (13.4 years), while tasks like “Print or request transportation carrier tickets” (12.0 years) and “Collect payment for transportation and accommodations” (11.5 years) remain. Several teaching professions experience deskilling because AI addresses tasks like grading, advising students, writing grants, and conducting research without being able to do the hands-on work of delivering lectures in person and managing a classroom.
接下来,我们计算剔除 AI 覆盖的任务后,剩余任务的平均教育水平如何变化。总体而言,其净的一阶影响是降低工作技能要求,因为 AI 移除了那些需要相对更高教育水平的任务。例如,技术写作人员这一职业就经历了技能降级,其中被移除的任务包括“分析特定领域的发展动态以确定是否需要修订”(18.7 年)和“审阅已发布的材料并建议在范围、格式方面进行修订或调整”(16.4 年),而保留下来的任务则包括“绘制草图以说明指定材料”(13.6 年)和“观察生产、开发及实验活动”(13.5 年)。旅行社代理也面临技能降级,因为 AI 覆盖了诸如“规划、描述、安排并销售行程套餐”(13.5 年)和“计算旅行及住宿费用”(13.4 年)等任务,而像“打印或申请运输承运商的票务”(12.0 年)和“收取交通与住宿费用”(11.5 年)等任务则被保留下来。 多个教学类职业也出现技能降级,因为 AI 处理了诸如评分、学生指导、撰写资助申请等任务。以及在无法亲自进行授课和管理课堂等实际工作的情况下开展研究。
Some jobs see average education levels increase. Real estate managers experience upskilling because AI covers routine administrative tasks—maintaining sales records (12.8 years), reviewing rents against market rates (12.6 years)—while tasks requiring higher-level professional judgment and in-person interaction remain, like securing loans, negotiating with architecture firms, and meeting with boards.
部分职业的平均教育水平有所提升。房地产经理人出现了技能升级现象,因为人工智能承担了日常行政任务——如维护销售记录(对应 12.8 年教育水平)、根据市场行情审核租金(对应 12.6 年教育水平)——而需要更高层次专业判断和面对面互动的任务则依然存在,例如获取贷款、与建筑公司谈判以及与董事会会面。
These patterns illustrate how jobs may evolve over the coming years as their task content adjusts in response to AI. If the education level can be interpreted like expertise in Autor and Thompson 's analysis, their framework might predict that wages will fall and employment will increase for technical writers and travel agents; conversely, real estate managers will specialize in complex negotiations and stakeholder management, shrinking employment while increasing wages.5
这些模式表明,随着工作任务内容因应人工智能而调整,未来几年各类职业可能会发生演变。如果将教育水平理解为 Autor 和 Thompson 分析中的专业技能,那么他们的框架或许会预测:技术写作人员和旅行代理人的工资将下降,而就业人数将增加;相反,房地产经理将专注于复杂的谈判和利益相关者管理,导致就业人数减少,但工资上涨。
However, our education-based measure differs from Autor and Thompson’s expertise concept: their framework would label some tasks as high expertise where ours specifies low education—for example, the Electrician task “Connect wires to circuit breakers, transformers, or other components.” And these predictions are based on current Claude usage patterns, which will shift as models are trained on new capabilities and users discover new applications—potentially changing which tasks are covered and whether the net effect is deskilling or upskilling.
然而,我们基于教育程度的衡量方式与 Autor 和 Thompson 所提出的“专业技能”概念有所不同:在他们的框架下,某些任务被归类为高专业技能,而我们的方法则将其归为低教育要求——例如,电工任务“将电线连接到断路器、变压器或其他组件”。此外,这些预测基于当前 Claude 的使用模式,而随着模型通过新能力进行训练,以及用户发现新的应用场景,这种模式将会发生变化,从而可能改变所覆盖的任务范围,并影响最终效果是去技能化还是技能提升。
Revisiting the aggregate productivity implications of Claude usage重新审视使用 Claude 对整体生产率的影响
In earlier work, we estimated that widespread adoption of AI could increase US labor productivity growth by 1.8 percentage points annually over the next decade. Here we revisit that analysis, incorporating the task success primitive introduced in this report and a richer treatment of task complementarity.
在早期的研究中,我们估计人工智能的广泛采用在未来十年内每年可使美国劳动生产率增长提高 1.8 个百分点。本文中,我们重新审视了这一分析,纳入了本报告中提出的任务成功率基本要素,并对任务互补性进行了更丰富的处理。
Based on the speedups associated with tasks with at least 200 observations in our sample of 1M Claude.ai conversations,6 we replicate our previous finding that current-generation AI models and current usage patterns imply a productivity effect of 1.8 percentage points per year over the next decade.7
基于我们对 100 万条 Claude.ai 对话样本中至少包含 200 次观测的任务所对应的加速效果, 6 我们再次验证了此前的发现:当前一代的 AI 模型及当前的使用模式意味着在未来十年内,每年将带来 1.8 个百分点的生产率提升效应。 7
With the inclusion of 1P API data, we can assess whether implied labor productivity effects differ based on enterprise Claude deployment patterns. Two countervailing forces are at play: API usage is more concentrated in a narrower set of tasks and occupations (particularly coding-related work), which would tend to reduce implied effects; but task-level speedups are higher on average among API tasks, as implied by Figure 4.1. These forces largely offset: the API sample likewise implies a 1.8 percentage point increase in labor productivity over the next decade.
通过纳入 1P API 数据,我们可以评估企业部署 Claude 的不同模式是否会导致隐含的劳动生产率效应存在差异。这里有两种相互抵消的力量在起作用:一方面,API 的使用更集中于较窄范围的任务和职业(尤其是与编程相关的工作),这往往会降低隐含的效应;但另一方面,如图 4.1 所示,API 相关任务在任务层面的平均加速效果更高。这两种力量大致相互抵消:API 样本同样暗示未来十年劳动生产率将提升 1.8 个百分点。
A salient critique of this analysis is that it fails to account for model reliability. If workers must validate AI output, the productivity benefits will be smaller than raw speedups suggest. To assess how quantitatively important this channel might be, we incorporate the task success primitive introduced in this report, multiplying task-level time savings by task-specific success rates before aggregating.8
对该分析的一个显著批评是,它未考虑模型的可靠性。如果工人必须验证 AI 的输出,那么实际的生产力提升将小于单纯由速度提升所暗示的幅度。为定量评估这一因素可能的重要性,我们在本报告中引入了任务成功率这一基本指标,在汇总之前,先将任务层面的时间节省乘以该任务特定的成功率。 8
This adjustment has a meaningful effect: implied productivity growth falls from 1.8 to 1.2 percentage points per year for the next decade based on Claude.ai usage, and to 1.0 percentage points for API traffic. Yet, even after accounting for reliability, the implied impact remains economically significant—a sustained increase of 1.0 percentage point per year for the next ten years would return US productivity growth to rates that prevailed in the late 1990s and early 2000s.A second critique concerns task complementarity. If some tasks are essential and cannot easily be substituted, then overall productivity effects will be constrained regardless of speedups on other tasks. Teachers may prepare lesson plans more efficiently with AI while having no impact on time spent with students in the classroom.
这一调整产生了显著影响:根据 Claude.ai 的使用情况,未来十年隐含的生产率年增长率将从 1.8 个百分点降至 1.2 个百分点;若以 API 流量计算,则进一步降至 1.0 个百分点。然而,即使考虑了可靠性因素,其隐含影响仍具有重要的经济意义——若未来十年生产率年增长率能持续提高 1.0 个百分点,美国的生产率增速将回升至 20 世纪 90 年代末和 21 世纪初的水平。 第二种批评意见涉及任务互补性。如果某些任务至关重要且难以被替代,那么无论其他任务的效率如何提升,整体生产率的提升仍将受到限制。例如,教师可能借助人工智能更高效地备课,但这对他们在课堂上与学生互动所花费的时间却毫无影响。
To operationalize this idea, we impose some structure on how we aggregate task-level time savings within occupations but otherwise add up occupational efficiency gains as in the main analysis. Specifically, we suppose that within each occupation tasks are combined according to a Constant Elasticity of Substitution (CES) aggregator, where each task is weighted by the estimated time spent on each task as calculated in our earlier analysis of the productivity effects implied by Claude usage.9
为将这一构想付诸操作,我们在职业内部对任务层级的时间节省进行聚合时施加一定的结构,而在其他方面则如主分析中那样累加各职业的效率提升。具体而言,我们假设在每个职业内部,各项任务通过一个常替代弹性(CES)聚合函数进行组合,其中每项任务的权重为其在我们此前关于 Claude 使用所隐含的生产率效应分析中估算出的时间占比。 9
The key parameter is the elasticity of substitution across tasks, σ. When the elasticity of substitution is less than one, tasks are complements and those tasks that are not sped up by AI become bottlenecks for broader productivity gains. Alternatively, when the elasticity of substitution is greater than one, then workers can allocate toward the more productive tasks—thereby amplifying the overall time savings at the occupational level. An elasticity of substitution equal to one is a special case that replicates the main analysis above.
关键参数是任务间的替代弹性σ。当替代弹性小于 1 时,各项任务互为互补关系,那些未因人工智能而加速的任务便成为制约整体生产率提升的瓶颈。反之,当替代弹性大于 1 时,劳动者可将更多精力分配至生产率更高的任务上,从而放大职业层面的总体时间节省效果。替代弹性等于 1 是一种特殊情况,此时结果与上述主分析一致。
Figure 4.6 reports the results of this exercise for different values of task substitutability. As expected, when the elasticity of substitution is equal to one the implied productivity effect is the same as in our baseline analysis: An increase in labor productivity growth of ~1.8 percentage points per year over the next decade implied by both Claude.ai and API samples.
图 4.6 报告了在不同任务替代弹性下该测算的结果。如预期所示,当替代弹性等于 1 时,所隐含的生产率效应与我们基准分析中的结果一致:Claude.ai 和 API 样本均表明,未来十年劳动力生产率增速将每年提升约 1.8 个百分点。

Figure 4.6 Implied labor productivity effect from AI as a function of within-occupation task substitutability 图 4.6 人工智能对劳动生产率的隐含影响(作为职业内部任务替代弹性的函数) This figure shows the implied aggregate labor productivity growth over the next decade based on efficiency gains estimated for tasks with at least 200 observations in our sample of 1M conversations on Claude.ai and 1M records from 1P API traffic. The elasticity of substitution governs how the degree to which non-AI enhanced tasks constrain the occupational productivity gains implied by Claude usage under a model in which occupational output is a CES index across tasks. An elasticity of =1 reproduces our unadjusted, baseline result of 1.8 percentage point increase in labor productivity growth over the next decade. Success-adjusted curves discount task-level speedups by task reliability. See text for more details. 该图显示了基于我们样本中 Claude.ai 上 100 万次对话和 1P API 流量中 100 万条记录所估计的、至少包含 200 个观测值的任务效率提升,推算出的未来十年隐含的总体劳动生产率增长。替代弹性(elasticity of substitution)决定了在一种模型下,非 AI 增强任务对 Claude 使用所带来的职业生产率增益的制约程度,该模型假设职业产出是各项任务的 CES(常替代弹性)指数。当弹性等于 1 时,结果与我们未调整的基线一致,即未来十年劳动生产率增速将提高 1.8 个百分点。经任务成功率调整后的曲线则根据任务可靠性对任务层面的加速效果进行了折减。更多细节见正文。
When tasks are complements, however, the implied aggregate labor productivity impact declines sharply as the economic effects are bottlenecked by tasks that AI speeds up the least. For example, at =0.5 the implied overall labor productivity effect is 0.7-0.9 percentage points per year—around half the size as implied by our baseline estimates. Additionally adjusting for task success further reduces the implied productivity effects to 0.8pp for Claude.ai and 0.6pp for API.
然而,当任务之间具有互补性时,隐含的总体劳动生产率影响会显著下降,因为经济效应受到 AI 提速最少的那些任务的瓶颈限制。例如,当弹性为 0.5 时,隐含的总体劳动生产率年均提升仅为 0.7 至 0.9 个百分点,约为基线估计值的一半。若进一步考虑任务成功率进行调整,则隐含的生产率效应将进一步降低至 Claude.ai 的 0.8 个百分点和 API 的 0.6 个百分点。
On the other hand, when the elasticity of substitution is greater than one, the implied labor productivity based on pre-Opus 4.5 usage patterns is materially higher. For example, at =1.5 the implied labor productivity effect rises to 2.2-2.6 percentage points per year, consistent with greater specialization in tasks where AI provides the largest speedups.
另一方面,当替代弹性大于 1 时,基于 Opus 4.5 发布前的使用模式所推断出的劳动生产率显著更高。例如,当弹性系数为 1.5 时,所推断的劳动生产率效应每年上升至 2.2 至 2.6 个百分点,这与在人工智能带来最大加速效果的任务中实现更高程度的专业化是一致的。
In both cases the implied productivity impact based on API traffic is more responsive to the degree of task substitutability. This is consistent with the fact that there is a larger share of API traffic concentrated in fewer tasks and associated occupations as compared to Claude.ai: When tasks are complements, this concentration amplifies the bottleneck problem; when they are substitutes, it amplifies productivity gains from task specialization.
在这两种情况下,基于 API 流量所推断的生产率影响对任务可替代程度的反应更为敏感。这与以下事实相符:与 Claude.ai 相比,API 流量更多地集中于更少的任务及相关职业中;当任务之间具有互补性时,这种集中会加剧瓶颈问题;而当任务之间具有可替代性时,则会放大因任务专业化带来的生产率提升。
What this analysis shows is that the productivity effects of automation may ultimately be constrained by bottleneck tasks that elude AI automation for the time being. And the labor market implications of increasingly capable AI could be similarly affected by such forces. For example, Gans and Goldfarb (2026) argue that the presence of bottleneck tasks within jobs means that partial AI automation can lead to an increase in labor income as such tasks increase in economic value (at least until a job is entirely automated).
本分析表明,自动化的生产率效应最终可能会受到当前尚无法被人工智能自动化的瓶颈任务的限制。而日益强大的人工智能对劳动力市场的影响,也可能同样受到此类因素的制约。例如,Gans 和 Goldfarb(2026)指出,由于工作岗位中存在瓶颈任务,部分人工智能自动化反而可能导致劳动收入增加,因为这些任务的经济价值会随之提升(至少在该工作被完全自动化之前如此)。
Conclusion 结论
The upshot of this chapter is that the impact of AI on the economy is unlikely to be uniform. As our effective AI coverage framework illustrates, the labor market implications for different workers will hinge on how reliable frontier AI tools are for their most central tasks.
本章的核心结论是,人工智能对经济的影响不太可能是均匀的。正如我们提出的“有效 AI 覆盖率”框架所展示的那样,不同劳动者在劳动力市场中所受的影响,将取决于前沿 AI 工具对其核心任务的可靠性程度。
But the labor market effects may also depend on the skill requirements of tasks that AI can proficiently handle relative to the rest of the economy. Indeed, we find that removing tasks Claude can already handle from the economy would produce a net deskilling effect: the tasks remaining for humans have lower educational requirements than those handled by AI.
但劳动力市场的影响还可能取决于人工智能能够熟练处理的任务相对于经济中其他任务的技能要求。事实上,我们发现,如果从经济中移除 Claude 已经能够处理的任务,将产生净“去技能化”(deskilling)效应:留给人类的任务所需的教育水平低于由 AI 处理的任务。
While highly suggestive, this may miss an important detail: the most complex tasks where Claude is used tend also to be those where it struggles most. Rather than displacing highly skilled professionals, this could instead reinforce the value of their complementary expertise in understanding AI’s work and assessing its quality.
尽管这一观点极具启发性,但它可能忽略了一个重要细节:Claude 被用于处理的最复杂任务,往往也是它表现最困难的任务。与其取代高技能专业人士,不如说这反而凸显了这些专业人士在理解 AI 工作并评估其质量方面的互补性专长的价值。
The counterpart to these transformative labor market effects is the broader impact on growth and productivity. On the one hand, incorporating task reliability into our analysis diminishes the implied effect on labor productivity growth as informed by current Claude usage patterns. If bottleneck tasks bind, the implied impact diminishes further. On the other hand, the continuing growth in model capabilities suggests that both task coverage and task success may increase, which, in turn, could increase productivity impacts.
与这些对劳动力市场的变革性影响相对应的,是更广泛的经济增长和生产率效应。一方面,将任务可靠性纳入分析后,根据当前 Claude 的使用模式所推断出的对劳动生产率增长的影响会有所减弱;如果瓶颈任务构成限制,这种影响将进一步降低。另一方面,模型能力的持续提升表明,任务覆盖范围和任务成功率都可能增加,从而可能进一步提升对生产率的影响。
1 When we study the correlation between primitives with the O*NET, we restrict to tasks appearing in at least 100 conversations to reduce measurement error. In the coverage analysis, we use all tasks above the privacy threshold of 15.
1 在研究经济原语与 O*NET 之间的相关性时,我们仅限于至少出现在 100 次对话中的任务,以减少测量误差。在覆盖范围分析中,我们使用所有高于隐私阈值(15)的任务。
2 Our online appendix is available at https://huggingface.co/datasets/Anthropic/EconomicIndex.
2 我们的在线附录可在 https://huggingface.co/datasets/Anthropic/EconomicIndex 获取。
3 See also Tomlinson et al (2025) for a related AI applicability score.
3 另见 Tomlinson 等人(2025)提出的相关 AI 适用性评分。
4 We generate embeddings for each task statement using a pretrained sentence transformer (all-mpnet-base-v2) and predict education with Ridge regression.
4 我们使用预训练的句子嵌入模型(all-mpnet-base-v2)为每个任务描述生成嵌入向量,并通过岭回归(Ridge regression)预测教育水平。
5 On the other hand, some historical evidence suggests that when technologies automating job tasks appear in patent data, employment and wages subsequently fall for exposed occupations (Webb 2020).
5 另一方面,一些历史证据表明,当专利数据中出现自动化工作任务的技术时,相关职业的就业和工资随后会下降(Webb,2020)。
6 When we first assessed the aggregate productivity implications of Claude usage, we relied on a sample of 100k Claude.ai conversations from Fall 2025. Based on the set of tasks for which we observed speedups, we estimated that labor productivity could be 1.8 percentage points higher per year over the next decade. Expanding the sample to 1M observations means that we need to take a stand on how to handle very infrequently occurring tasks—which are very common given that usage follows a power law, as we documented in our past report. We choose a threshold of 0.02% because it replicates our previous results for our sample of Claude.ai conversations. For privacy-preserving reasons, we only ever analyze tasks with at least 15 observations, or an implied threshold of 0.015% for a 100k sample. And so our results are internally consistent across samples. If we do not impose a restriction on our 1M sample and assume that efficiency gains for any task in our sample, even those with just 15 observations out of one million, the implied aggregate labor productivity growth over the next decade would be roughly 5% percentage points per year—a mechanical increase based on a the much larger set of tasks included.
6 当我们首次评估使用 Claude 对整体生产率的影响时,依据的是 2025 年秋季从 Claude.ai 提取的 10 万次对话样本。基于我们观察到效率提升的任务集,我们估计未来十年每年劳动生产率可能提高 1.8 个百分点。将样本扩大至 100 万次观测后,我们需要明确如何处理那些极少出现的任务——鉴于使用情况遵循幂律分布(如我们此前报告所述),这类任务实际上非常普遍。我们选择 0.02% 作为阈值,因为这能复现我们之前基于 Claude.ai 对话样本所得的结果。出于隐私保护的考虑,我们仅分析至少出现 15 次的任务,对于 10 万样本而言,这相当于隐含的 0.015% 阈值。因此,我们的结果在不同样本间保持了内部一致性。 如果我们不对 100 万样本施加限制,并假设样本中所有任务(包括那些在一百万次观测中仅有 15 次观测值的任务)都能实现效率提升,那么未来十年内所隐含的总体劳动生产率增长将约为每年 5 个百分点——这一机械性增长是基于纳入了更多任务的结果。
7 As before, this result is based on applying Hulten’s Theorem to task-level productivity shocks and assuming that the corresponding one-time increase in total factor productivity materializes over the course of a decade alongside capital deepening effects.
7 与之前一样,该结果是通过将霍尔滕定理(Hulten’s Theorem)应用于任务层面的生产率冲击得出的,并假设相应的全要素生产率一次性提升会随着资本深化效应在未来十年内逐步实现。
8 As a reminder, for aggregating to implied labor productivity we calculate task-level efficiency gains as the log difference between human time without AI and with AI. There are certainly other ways to adjust based on task reliability. If tasks in our sample are composed of sub-tasks with heterogeneous AI applicability, and workers optimally deploy AI only on sub-tasks where it is effective, then scaling the efficiency gain by the success rate captures the extensive margin of AI adoption within a task.
8 需要提醒的是,在汇总为隐含劳动生产率时,我们通过计算使用 AI 前与使用 AI 后人类所需时间的对数差值来衡量任务层面的效率提升。当然,也可以根据任务可靠性采用其他调整方法。如果样本中的任务由多个子任务组成,而这些子任务在 AI 适用性上存在差异,且工作者仅在 AI 有效的子任务上最优地部署 AI,那么通过成功率对效率提升进行缩放,即可捕捉到任务内部 AI 采用的广延边际。
9 We use a CES (constant elasticity of substitution) production function to aggregate task-level time savings to economy-wide productivity impacts. The elasticity parameter σ governs how easily workers can substitute between tasks. When σ=1, we apply Hulten’s theorem directly: the aggregate productivity gain equals the wage-share-weighted sum of log speedups across tasks. For σ≠1, we use a two-level aggregation: first, within each occupation, we compute an occupation-level speedup as a CES aggregate of task speedups weighted by time fractions, using ρ=(σ-1)/σ. Then we apply Hulten’s theorem to these occupation-level speedups. When σ<1 (complements), productivity gains are bottlenecked by tasks with the smallest speedups. When σ>1 (substitutes), workers can specialize in tasks where AI provides the largest speedups, amplifying aggregate gains. For tasks without observed AI speedup data, we assume no productivity change. We thank Pascual Restrepo for suggesting this particular exercise.
9 我们采用 CES(常替代弹性)生产函数,将任务层面的时间节省汇总为对整体经济生产率的影响。弹性参数σ决定了劳动者在不同任务之间进行替代的难易程度。当σ=1 时,我们直接应用霍尔滕定理(Hulten’s theorem):总体生产率提升等于各任务对数加速比按工资份额加权后的总和。当σ≠1 时,我们采用两级汇总:首先,在每个职业内部,利用ρ=(σ-1)/σ,以任务所占时间比例为权重,对任务加速比进行 CES 汇总,得到职业层面的加速比;然后,将霍尔滕定理应用于这些职业层面的加速比。当σ<1(任务间互补)时,生产率提升受限于加速比最小的任务;当σ>1(任务间可替代)时,劳动者可专注于 AI 带来最大加速比的任务,从而放大整体收益。对于缺乏观测到的 AI 加速比数据的任务,我们假定其生产率未发生变化。我们感谢帕斯夸尔·雷斯特雷波(Pascual Restrepo)提出这一具体分析思路。
Concluding Remarks 结论
This fourth Anthropic Economic Index Report introduces economic primitives—foundational characteristics of AI use—that show how Claude is used by both consumers and firms. We use Claude to estimate the extent to which usage varies along these dimensions; these measures are directionally accurate and, taken together, provide important signals even if individual classifications are imperfect.
第四份 Anthropic 经济指数报告引入了“经济原语”(economic primitives)——即 AI 使用的基础特征,用以揭示 Claude 在消费者和企业中的使用方式。我们利用 Claude 来估算其在这些维度上的使用差异程度;这些衡量指标具有方向上的准确性,即使个别分类并不完美,综合起来仍能提供重要的信号。
Our findings carry significant implications for how AI will reshape economies and labor markets. Notably, Claude tends to be used more, and appears to provide greater productivity boosts, on tasks that require higher education. If these tasks shrink for US workers, the net effect could be to deskill jobs. But these impacts depend crucially on complementarity across tasks, and whether increased productivity at a certain task may increase the demand for it.
我们的研究发现对 AI 将如何重塑经济和劳动力市场具有重大意义。值得注意的是,Claude 在需要更高教育水平的任务上使用更为频繁,且似乎能带来更大的生产率提升。如果这类任务在美国劳动者的工作中减少,其净效应可能是导致工作技能要求下降(即“去技能化”)。然而,这些影响在很大程度上取决于不同任务之间的互补性,以及某项任务生产率的提高是否会增加对该任务的需求。
At the global level, the strong relationship between per capita income and usage patterns—with higher-income nations using Claude collaboratively while lower-income countries focus on coursework and specific applications—suggests that AI’s impact will be mediated by existing institutional structures rather than unfolding uniformly. Geographic diffusion patterns reinforce this picture. Within the US, per capita usage has converged slightly; globally, diffusion is slower. Combined with income-driven differences in how AI is used, this raises questions about whether AI will narrow or widen international economic gaps.
在全球层面,人均收入与使用模式之间存在显著关联:高收入国家更倾向于协作式使用 Claude,而低收入国家则主要将其用于课程作业和特定应用场景。这表明,人工智能的影响将受到现有制度结构的调节,而非以统一方式展开。地理扩散模式进一步印证了这一图景。在美国国内,人均使用量已略有趋同;而在全球范围内,扩散速度则更为缓慢。结合由收入驱动的人工智能使用方式差异,这引发了一个关键问题:人工智能究竟会缩小还是扩大国际经济差距?
Equally important to the patterns documented here are potential changes across this and subsequent reports. As AI capabilities advance, Claude’s success rate may increase, usage patterns may show greater autonomy, users may tackle new and more complex tasks, and tasks that prove automatable may graduate from interactive chat to API deployment. We will track these dynamics over time, providing a longitudinal view of AI’s role in the economy.
与此处所记录的模式同样重要的是本报告及后续报告中可能出现的变化。随着人工智能能力的不断提升,Claude 的成功率可能提高,使用模式可能展现出更高的自主性,用户可能开始处理更新、更复杂的任务,而那些被证明可自动化的任务也可能从交互式聊天逐步转向 API 部署。我们将持续追踪这些动态,从而提供对人工智能在经济中所扮演角色的纵向观察。
Building on prior releases, this edition significantly expands both the scope and transparency of usage data we share, including task-level classifications along new dimensions and regional breakdowns globally for the first time. We publish this data to enable researchers, journalists, and the public to investigate novel questions about AI’s economic impacts that can form the empirical foundation for policy responses.
在以往发布的基础上,本版报告显著扩展了我们所共享使用数据的范围和透明度,首次新增了按任务层级分类的多维度数据以及全球各地区的细分数据。我们发布这些数据,旨在使研究人员、记者和公众能够探索有关人工智能经济影响的新问题,从而为政策回应提供实证基础。
How willing users are to experiment with AI, and whether policymakers create a regulatory context that advances both safety and innovation, will shape how AI transforms economies. For AI to benefit users globally, expanding access alone will not suffice—developing the human capital that enables effective use, particularly in lower-income economies, is essential.
用户对尝试人工智能的意愿程度,以及政策制定者是否营造出兼顾安全与创新的监管环境,将共同塑造人工智能对经济的变革方式。要使人工智能惠及全球用户,仅扩大访问权限是不够的——尤其在低收入经济体中,培养能够有效使用人工智能的人力资本至关重要。
Authors & Acknowledgements作者与致谢
First Author Block*: 第一作者信息*:
Ruth Appel, Maxim Massenkoff, Peter McCrory
露丝·阿佩尔(Ruth Appel)、马克西姆·马森科夫(Maxim Massenkoff)、彼得·麦科里(Peter McCrory)
*Lead authors of the report
*报告的主要作者
Second Author Block: 第二作者组:
Miles McCain, Ryan Heller, Tyler Neylon, Alex Tamkin
迈尔斯·麦凯恩、瑞安·赫勒、泰勒·尼伦、亚历克斯·塔姆金
Acknowledgements 致谢
Xabi Azagirre, Tim Belonax, Keir Bradwell, Andy Braden, Dexter Callender III, Sylvie Carr, Miriam Chaum, Ronan Davy, Evan Frondorf, Deep Ganguli, Kunal Handa, Andrew Ho, Rebecca Jacobs, Owen Kaye-Kauderer, Bianca Lindner, Kelly Loftus, James Ma, Jennifer Martinez, Jared Mueller, Kelsey Nanan, Kim O’Rourke, Dianne Penn, Sarah Pollack, Ankur Rathi, Zoe Richards, Alexandra Sanderford, David Saunders, Michael Sellitto, Thariq Shihipar, Michael Stern, Kim Withee, Mengyi Xu, Tony Zeng, Xiuruo Zhang, Shuyi Zheng, Emily Pastewka, Angeli Jain, Sarah Heck, Jared Kaplan, Jack Clark, Dario Amodei
哈比·阿扎吉雷、蒂姆·贝洛纳克斯、基尔·布拉德韦尔、安迪·布拉登、小德克斯特·卡伦德、西尔维·卡尔、米里亚姆·乔姆、罗南·达维、埃文·弗龙多夫、迪普·甘古利、库纳尔·汉达、安德鲁·霍、丽贝卡·雅各布斯、欧文·凯-考德勒、比安卡·林德纳、凯莉·洛夫特斯、詹姆斯·马、詹妮弗·马丁内斯、贾里德·穆勒、凯尔西·纳南、金·奥鲁克、黛安·彭、莎拉·波拉克、安库尔·拉希、佐伊·理查兹、亚历山德拉·桑德福德、大卫·桑德斯、迈克尔·塞利托、塔里克·希希帕尔、迈克尔·斯特恩、金·威西、徐梦怡、托尼·曾、张修若、郑书仪、艾米莉·帕斯泰卡、安杰莉·贾因、莎拉·赫克、贾里德·卡普兰、杰克·克拉克、达里奥·阿莫代伊
Citation 引用
1 | @online{anthropic2026aeiv4, |